
Figure 2.
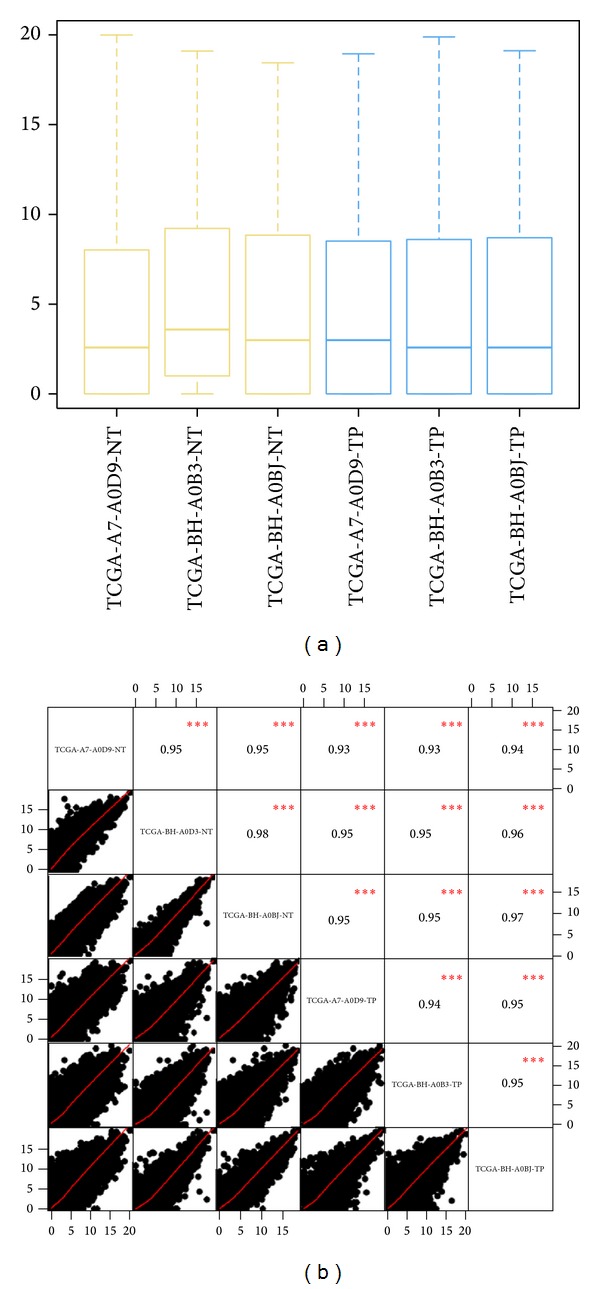
(a) Boxplots of gene raw read count. (b) Correlation matrix of all genes between all pairs of samples using raw read count.
Official websites use .gov
A
.gov website belongs to an official
government organization in the United States.
Secure .gov websites use HTTPS
A lock (
) or https:// means you've safely
connected to the .gov website. Share sensitive
information only on official, secure websites.
(a) Boxplots of gene raw read count. (b) Correlation matrix of all genes between all pairs of samples using raw read count.