
Figure 3.
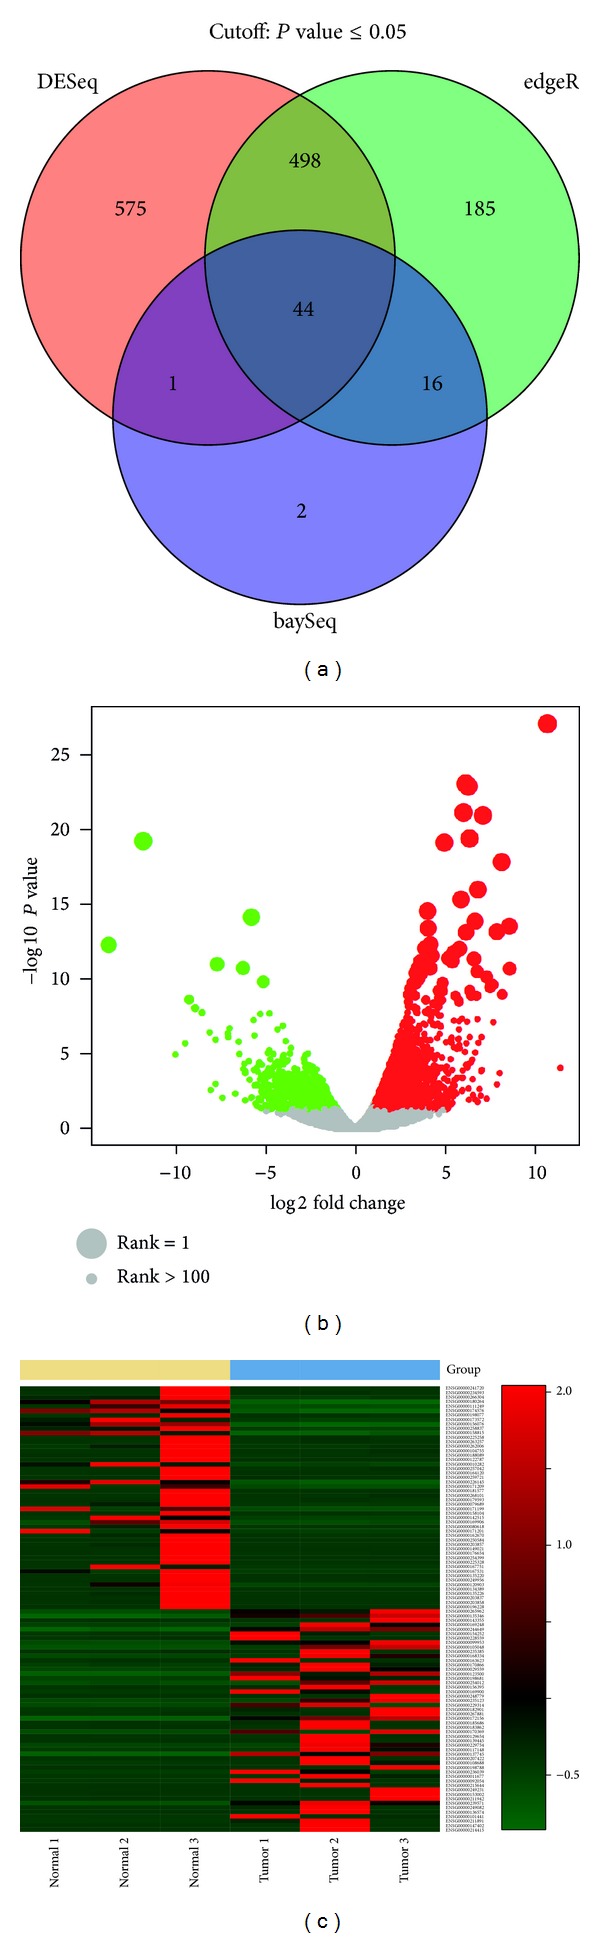
(a) Venn diagram of differential expression analyses by DESeq, edgeR, and baySeq. The Venn diagram can be drawn based on P value, fold change, or rank. (b) Scalable volcano plot representing fold change, P value, and rank. Rank is presented as the size of the circle, and larger size denotes higher ranking. (c) Heatmap of top differentially expressed genes. MultiRankSeq produces heatmap based on P value, fold change, and rank; only genes selected by fold change are shown here.