Figure 13.

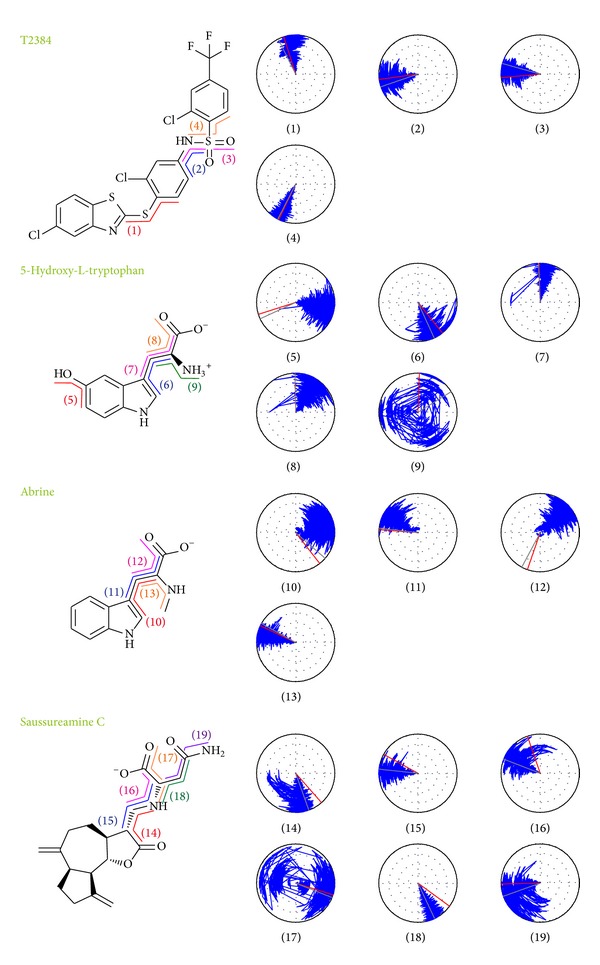
Variation of ligand torsion angles for each of PPAR-γ complexes during 40 ns of MD simulation. Red and gray lines represent the ligand torsion angle at docking simulation and first conformation of MD simulation, respectively.

Variation of ligand torsion angles for each of PPAR-γ complexes during 40 ns of MD simulation. Red and gray lines represent the ligand torsion angle at docking simulation and first conformation of MD simulation, respectively.