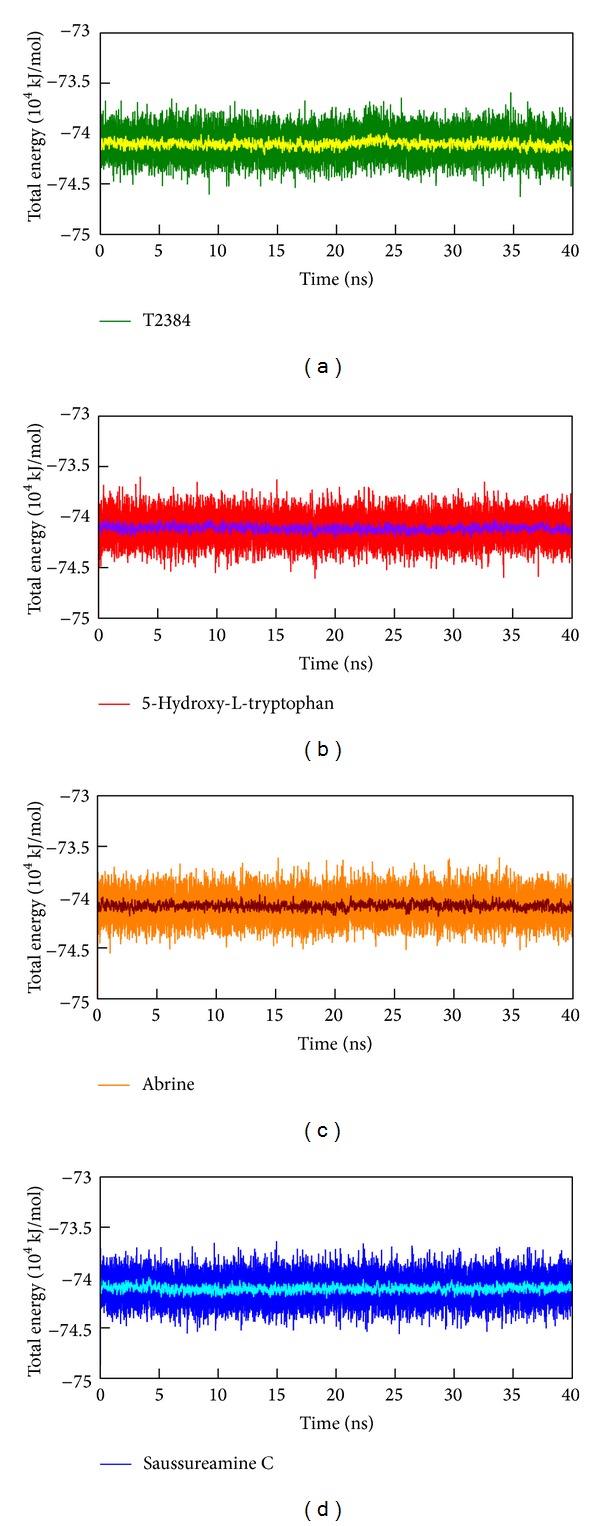
Figure 7.

Total energy of PPAR-γ complexes with (a) T2384, (b) 5-hydroxy-L-tryptophan, (c) abrine, and (d) saussureamine C over 40 ns MD simulation. The average fluctuations in a cycle of 21 frames were illustrated by yellow (T2384), violet (5-hydroxy-L-tryptophan), wine (abrine), and cyan (saussureamine C) line, respectively.
