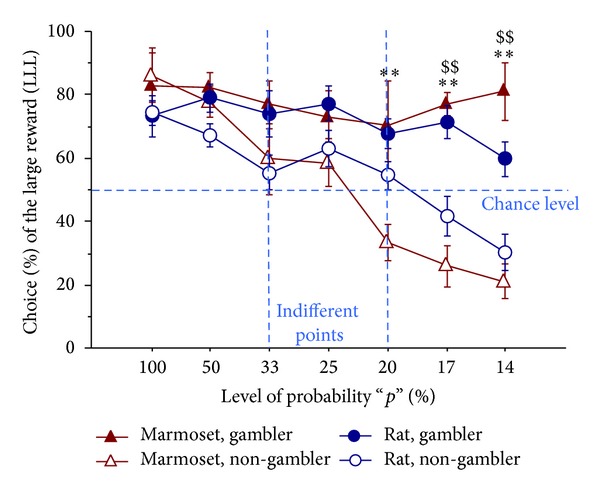
Figure 2.

Gambling proneness: preference (%) for the LLL reward. Mean (±SEM) choice (%) of the large reward (LLL), shown by rats and marmosets belonging to the two distinct subpopulations (“gambler” versus “non-gambler”, n = 5-6 per group). On the final “gambling” part of the testing phase, “non-gambler” individuals (both rats and marmosets) were progressively shifting towards a clear-cut SS preference. By contrast, in “gamblers” (both rats and marmosets), LLL preference remained significant, even beyond the indifferent point (when LLL became a suboptimal option). **P < 0.01 gambler marmosets significantly different from non-gambler marmosets in post hoc test; $$ P < 0.01 gambler rats significantly different from non-gambler rats in post hoc test.
