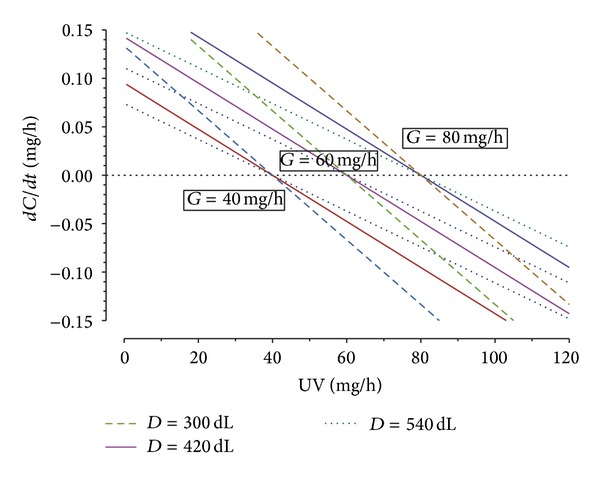
Figure 1.

Rate of change of serum creatinine (C) as a function of excretion (UV) for different creatinine production rates (G) and volumes of distribution (D); see (1). dC/dt below zero indicates falling serum creatinine and above zero indicates increasing serum creatinine.
