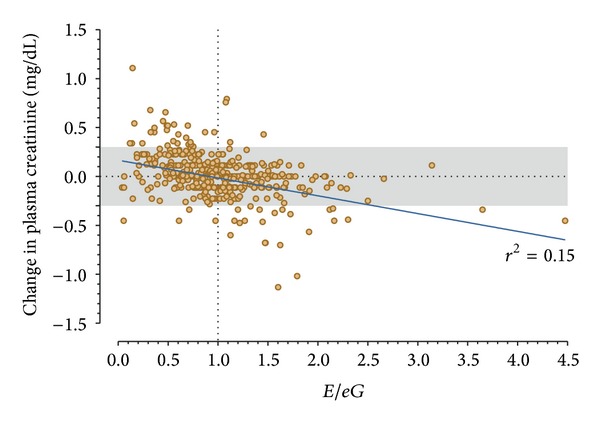
Figure 2.

Change in plasma creatinine over 12 hours as a function of E/eG. The solid line is the linear regression line. Patients above the shaded region had an increase of plasma creatinine ≥0.3 mg/dL (AKI). Patients below the shaded region had a decrease in plasma creatinine ≥0.3 mg/dL (recovering AKI).
