
Figure 3.
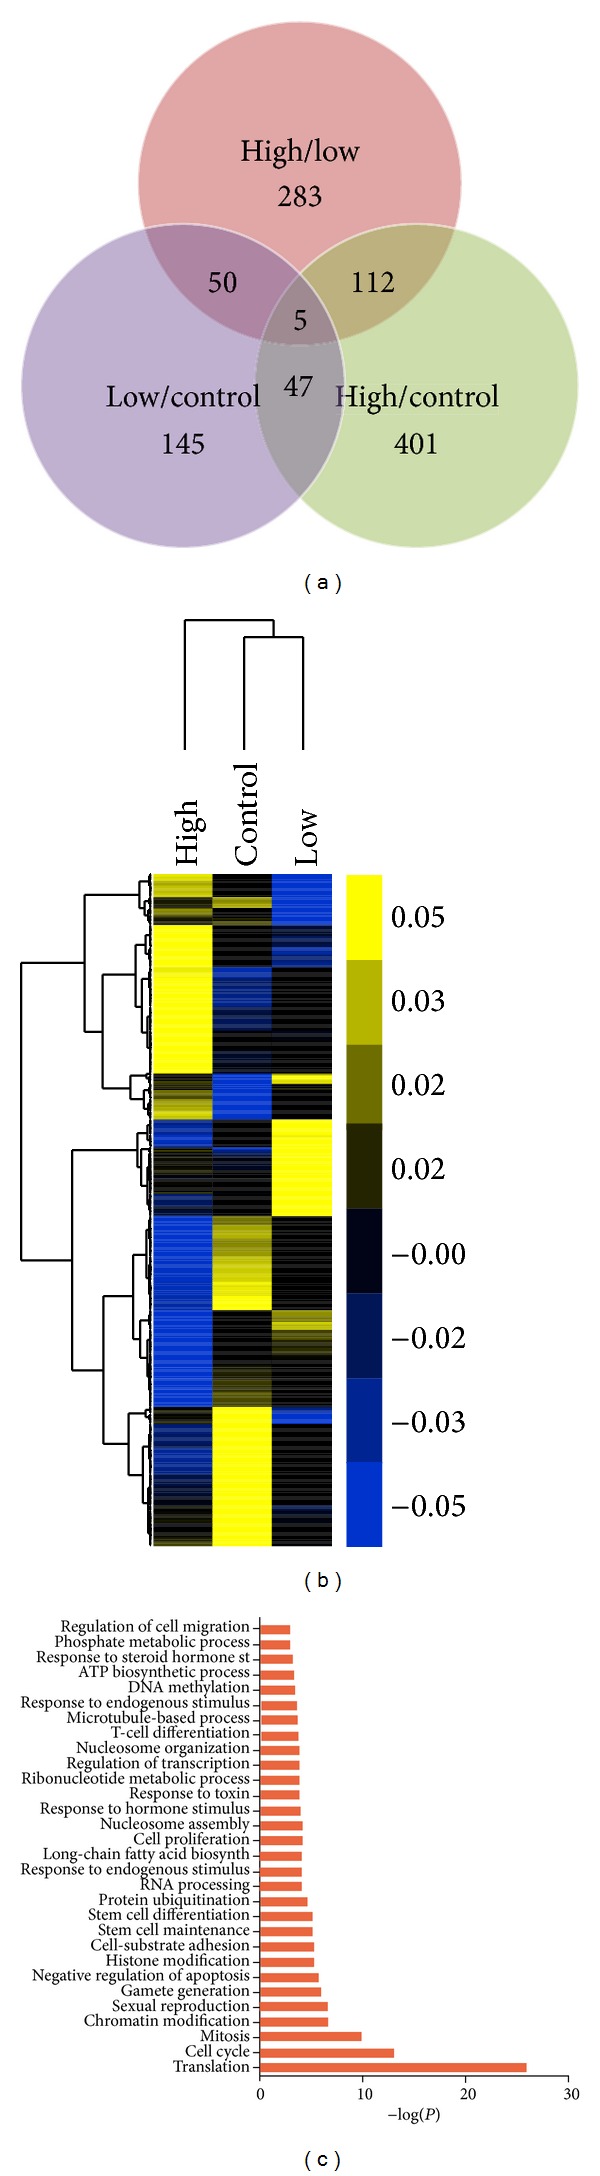
Cadmium modulated differentially expressed genes analysis. (a) The number of genes differentially expressed between the high level cadmium treated, low level cadmium treated, and control groups. (b) Hierarchical clustering analysis of gene expression profiles. Each column represents one mouse, and each horizontal line refers to a gene. Color legend is on the top-left of the figure. Yellow indicates genes with a greater expression relative to the geometrical means; blue indicates genes with a lower expression relative to the geometrical means. (c) Biological process Gene Ontology (GO) analysis of differentially expressed genes.