
Figure 4.
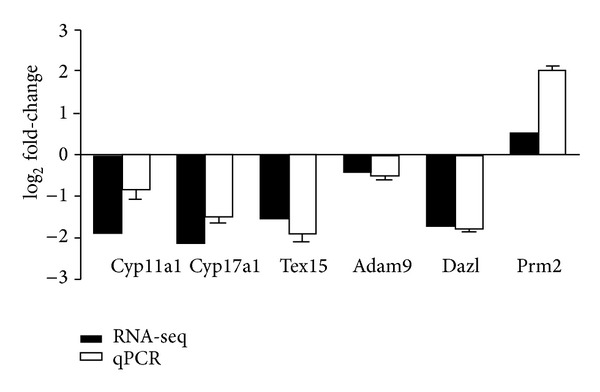
qPCR validation of the RNA-seq data. log2-fold change determined from the relative Ct values of six genes were compared to those detected by RNA-seq. Replicates (n = 3) of each sample were run and the Ct values averaged. All Ct values were normalized to beta-actin. P values of the Q-PCR data are 0.002 (Cyp11a1), 0.02 (Cyp17a1), 0.012 (Tex15), 0.014 (GLRX2), 0.008 (Adam9), 0.016 (Dazl), and 0.014 (Prm2), respectively.