Figure 3.

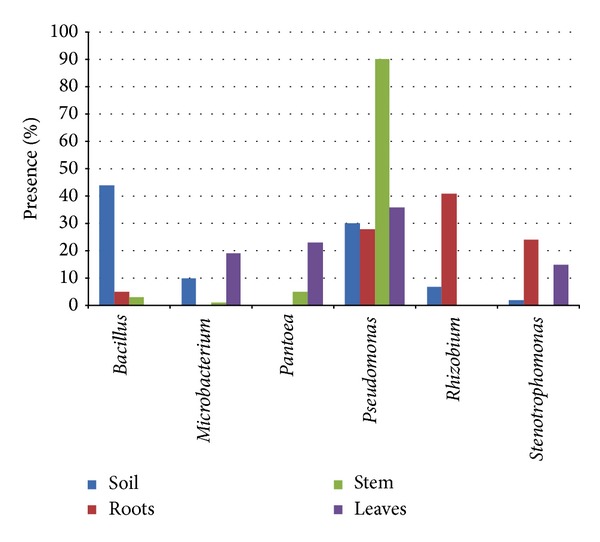
Comparison of the relative abundance of bacterial genera in the different samples; only genera with percentages >5% in at least one of the samples are reported.

Comparison of the relative abundance of bacterial genera in the different samples; only genera with percentages >5% in at least one of the samples are reported.