
Figure 1.
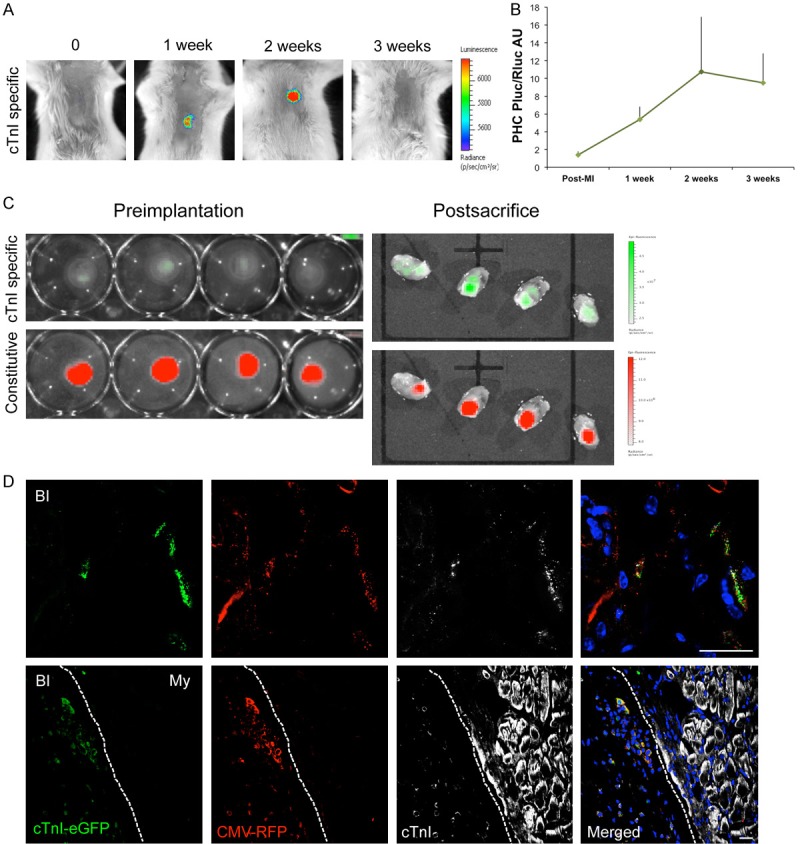
BLI and fluorescent evaluation of cTnI expression and survival of subATDPCs implanted over the mouse infarcted myocardium. A: Representative BLI of labeled subATDPCs within the bioactive implant displays the luciferase signal from the cell differentiation reporter (PLuc-eGFP) that is regulated by the hcTnI promoter. Images of the hcTnI-specific reporter are superimposed on black-and-white dorsal images of the recipient animal. Color bars illustrate relative light intensities from PLuc. B: Histograms of the PLuc/RLuc ratio calculated from photon fluxes recorded via BLI from bioactive implant-treated infarcted animals. C: Representative fluorescence images from subATDPCs within the bioactive implant pre-implantation and post-sacrifice over the excised hearts. Upper images show fluorescence from the cell differentiation reporter (PLuc-eGFP) regulated by hcTnIp (green). Bottom images are representative of constitutive fluorescence from the cell-number reporter (CMVp-RLuc-mRFP1; red). Color bars illustrate the relative fluorescence intensities from eGFP (green) and RFP (red). D: Immunofluorescence staining of mouse heart cross-sections shows the bioactive implant filled with human subATDPCs. Transplanted cells were detected via RFP immunostaining (red), and cTnI expression was detected with anti-eGFP (green) and anti-cTnI (white) antibodies. (BI, bioactive implant; My, myocardium). Scale bars, 20 μm.