
Figure 2.
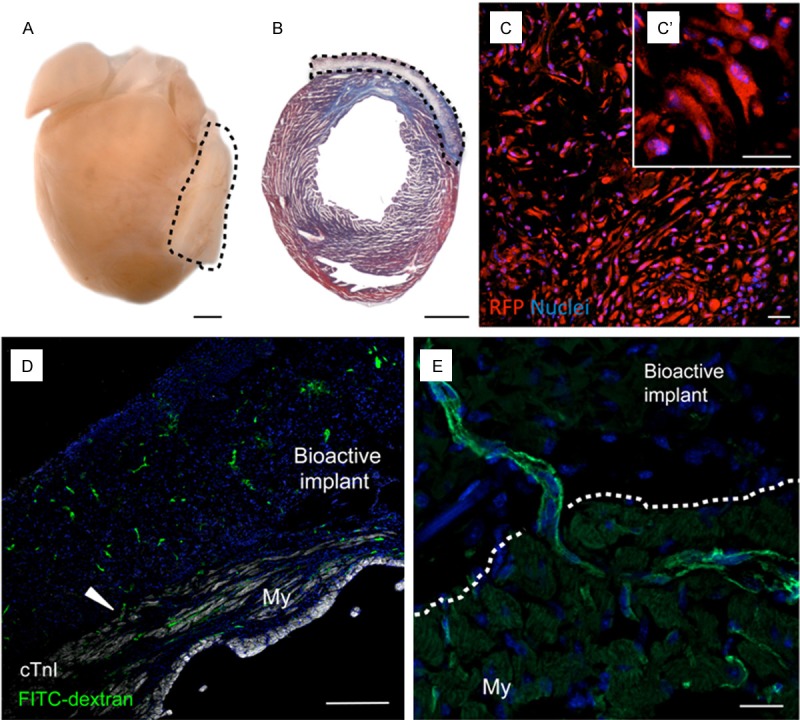
Adaptability and vascularization of the bioimplant in the mouse model of MI. A: Representative image of a heart excised from a bioactive implant-treated animal. Dotted lines indicate localization of the implant. Scale bars, 1 mm. B: Masson’s trichrome staining in a heart cross-section reveals the presence of a myocardial scar (blue) and the good adaptability of the bioactive implant. Scale bars, 1 mm. C: Cells inside the bioactive implant three days post-implantation were detected via the constitutively active reporter CMVp-RLuc-mRFP1 (red). C’: Detail of the spindle-shape morphology of subATDPCs. Scale bars, 25 μm. D and E: Functional vessel detection with FITC-dextran (green) in mice treated with subATDPCs. Arrowheads indicate a vessel connection between the mouse myocardium and the bioactive implant in a cell-treated animal. Nuclei were counterstained with Hoechst 33342. Scale bars, 20 μm and 250 μm.