
Figure 3.
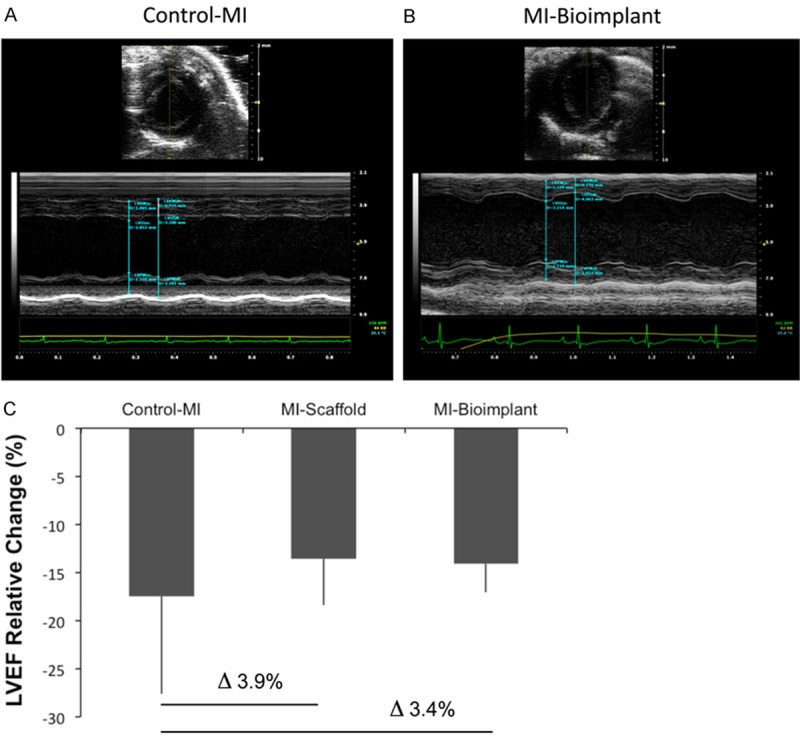
Cardiac functional analysis. Representative images and measurements of the LVEF of control-MI (A) and bioactive implant-treated animals (MI-bioimplant) (B) in short axis M-mode. (C) Percentage of LVEF relative change in infarcted groups (control-MI, MI-scaffold, and MI-bioimplant) expressed as the differences between the post-MI and pre-sacrifice values.