
Figure 3.
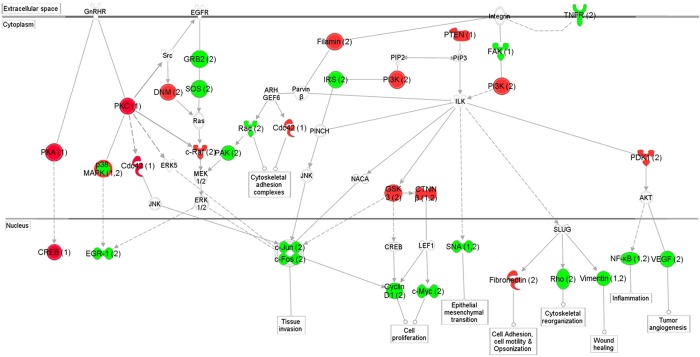
Schematic representation of the signaling networks affected in breast cancer as determined by protein and mRNA expressions. The network is displayed graphically as nodes (protein or mRNA) and edges (the biological relationship between the nodes). The nodes are represented using various shapes that represent the functional class of the protein products. The up- and down-regulation of each node is shaded in red and green, respectively. The nodes without color were not assessed or without difference in this study but identified by IPA as important nodes involved in the network. The number after each node indicates the changes determined by either protein (1) or mRNA (2). The P38 is up regulated in the protein level but down regulated in the mRNA level.