Fig. 3.

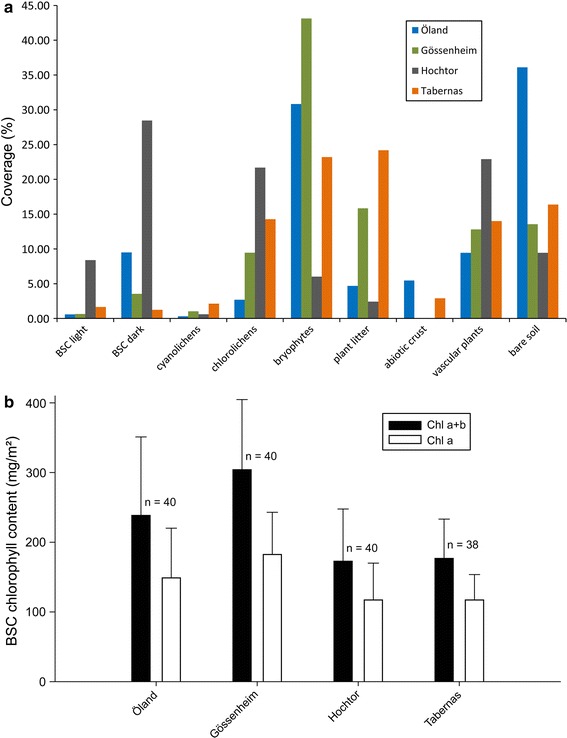
a Coverage of the different crust types and other vegetation at all sites; b chlorophyll content (a and a + b; lines in bars show standard deviation) at all sites

a Coverage of the different crust types and other vegetation at all sites; b chlorophyll content (a and a + b; lines in bars show standard deviation) at all sites