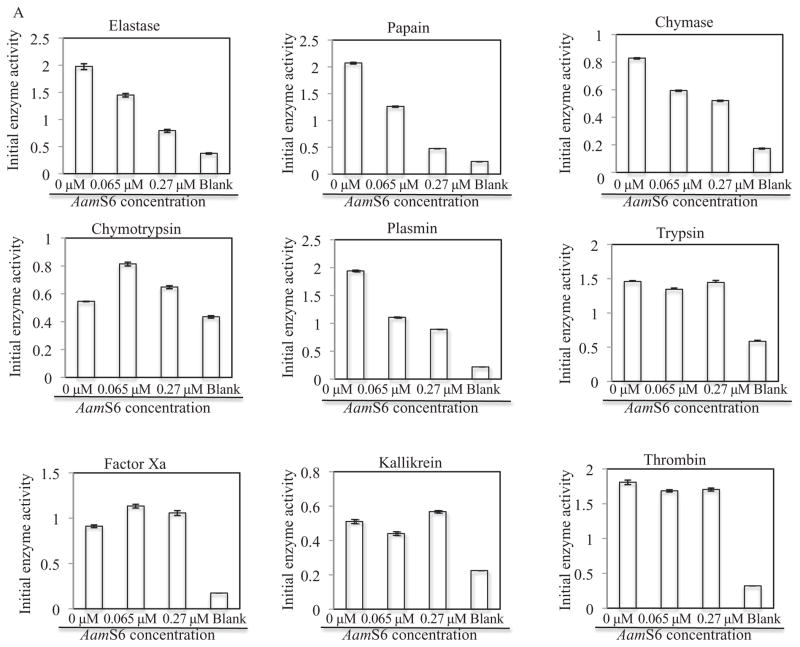
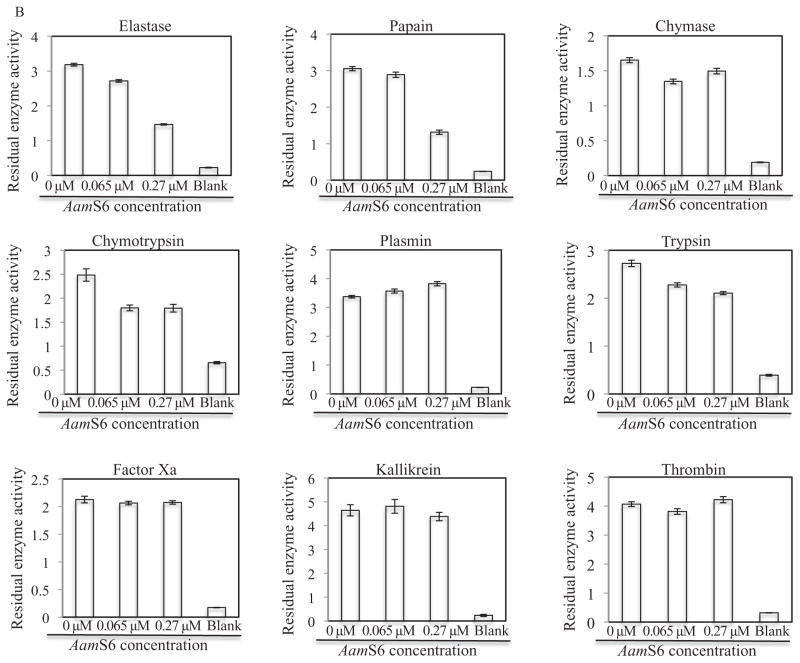
Figure 2.
Protease inhibitor function profiling of rAamS6. Indicated candidate proteases (500 ng) were co-incubated with affinity purified, 0.34 μg and 1.4 μg or 0.066 μM and 0.27 μM for 15 min at 25 °C. After incubation, appropriate peptide substrates were added to final concentrations indicated in materials and methods. Subsequently the release of the chromophore, p-nitroanilide as proxy for substrate hydrolysis was monitored at A410 using the VersaMax microplate reader. The observed A410 were converted to released μM concentrations of digested peptides as described in materials and methods. Non-linear regression in Graphpad software was used to fit the second order polynomial and the Michaelis and Menten equations on our data to respectively estimate (A) the initial velocities of substrate hydrolysis, and (B) the maximum velocity of substrate hydrolysis.


