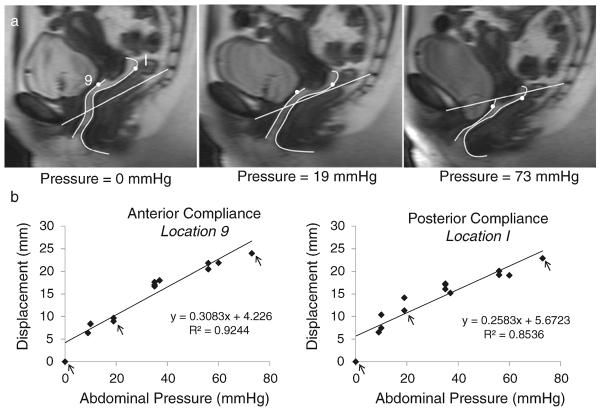
Fig. 2.
Quantification of vaginal wall support compliance. Panel a, sequential MR images from a single individual with normal anatomy were taken with pressure ranging from rest to maximum Valsalva. The SCIPP line was drawn and anterior and posterior vaginal walls were traced. Panel b, example of the calculation of the anterior and posterior vaginal wall support compliance using points 9 (AVW) and I (PVW) on the vaginal wall. A linear relationship between the vaginal wall displacement and the intra-abdominal pressure was found. Arrows in the plots indicate the example shown in panel a, pointing out the measurements of points 9 (AVW) and I (PVW) on the selected MR images. In these examples, the anterior wall support compliance and the posterior wall support compliance at these points were 0.308 mm/mmHg and 0.258 mm/mmHg respectively

