Fig. 3.

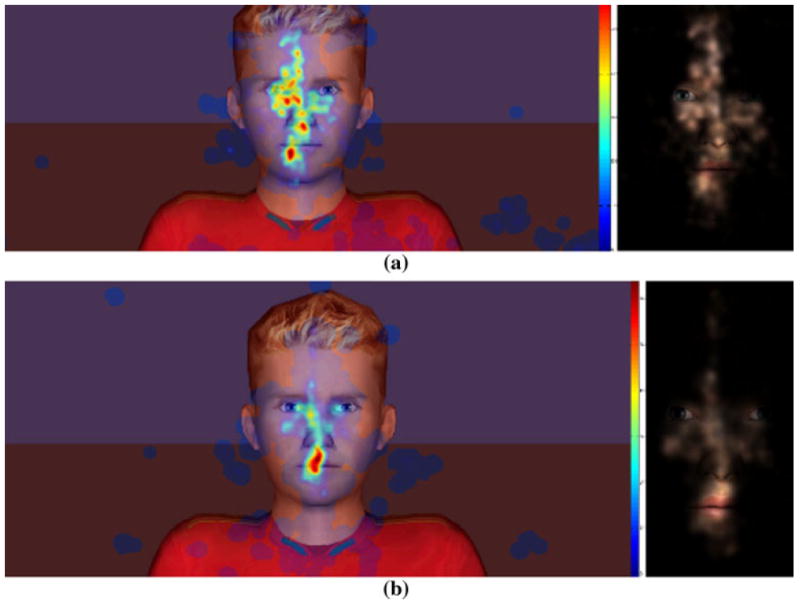
Intergroup comparison gaze visualizations (heat maps and masked scene maps) a combined gaze in the ASD group for all the trials and all participants b combined gaze in the TD group for all the trials and all participants

Intergroup comparison gaze visualizations (heat maps and masked scene maps) a combined gaze in the ASD group for all the trials and all participants b combined gaze in the TD group for all the trials and all participants