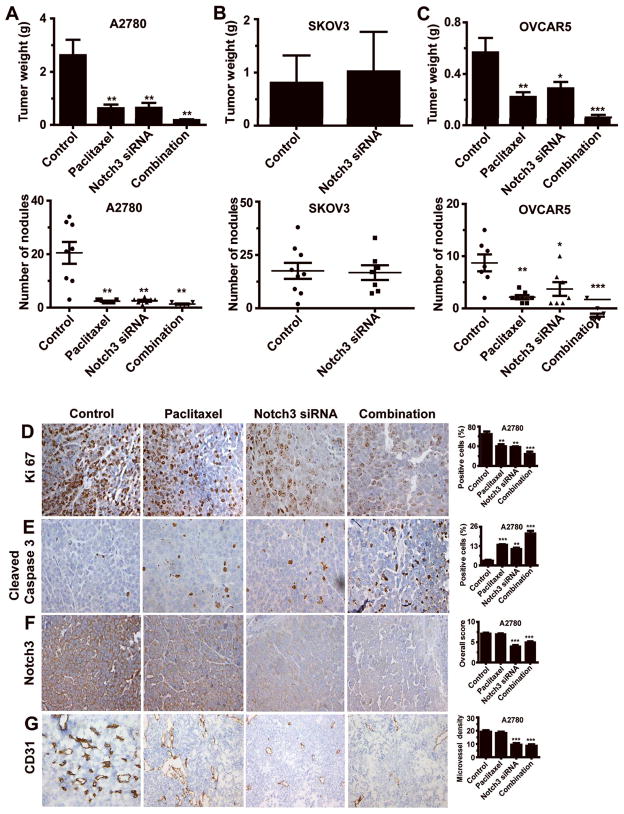
Figure 6. In Vivo Study of Notch3 siRNA in Mouse Models of Ovarian Cancer (OvCa).
(A–C) Effect of treatment with Notch3 siRNA and/or paclitaxel on tumor weight in Notch3 intracellular domain (NICD3)-positive models (OVCAR5 and A2780) and NICD3-negative model (SKOV3). The error bars represent standard error of the mean (SEM). *p < 0.05; **p < 0.01; ***p < 0.001. (D–G) Effect of treatment with Notch3 siRNA and/or paclitaxel on biological endpoints: cell proliferation (Ki67 expression), apoptosis (cleaved caspase-3 expression), Notch3 expression and microvessel density (CD31). Original magnification, 200×. The error bars represent standard error of the mean (SEM). *p < 0.05; **p < 0.01; ***p < 0.001.

