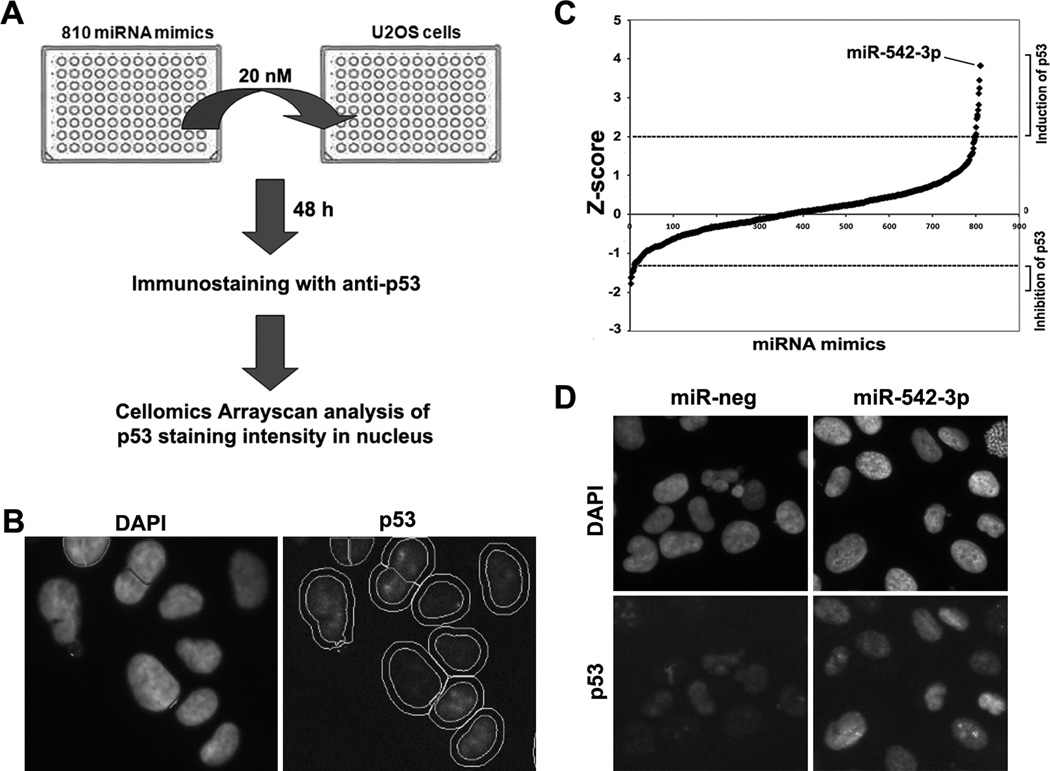
Figure 1. Identification of miRNAs that regulate p53 expression.
(A) Scheme of miRNA gain-of-function screening for p53 immunofluorescence staining intensity in U2OS cells. (B) Representative images of p53 immunofluorescence staining. Nuclear regions were marked with circles (inner circle) based on DAPI staining. The outer circles were used to determine the intensity of p53 staining in cytoplasm (signal in ring region). (C) Z-score plot of miRNA mimics in the regulation of nuclear p53 immunofluorescent intensity. Several miRNA mimics were identified to positively or negatively affect p53-staining intensity (Z-score >2 or <-1.2)(Supplemental Table S1). MiR-542-3p is the top hit that modulated p53-staining intensity in U2OS. (D) Representative images of p53 immunofluorescence staining in miR-neg or miR-542-3p transfected cells.

