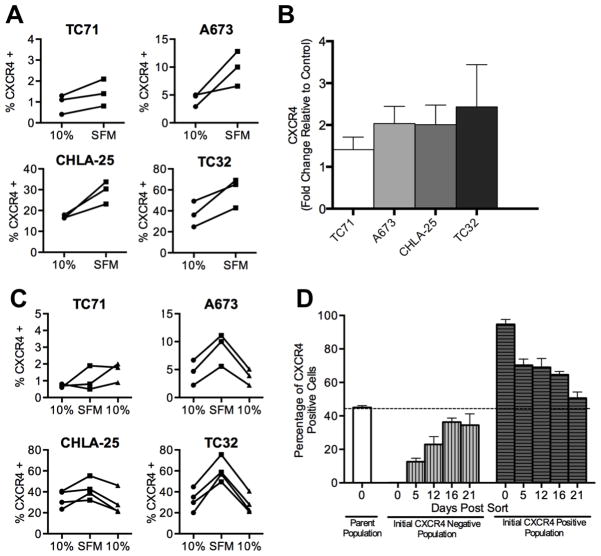
Figure 2. CXCR4 expression is reversibly induced in response to growth factor deprivation.
A. Surface expression of CXCR4 was determined by flow cytometry as in Figure 1 for Ewing sarcoma cells plated under standard (10% FBS) and serum deprived (Serum free media, SFM) conditions. Exposure of cells to SFM for 24 hours resulted in upregulation of CXCR4. Each line and pair of data points represents the data for an independent experiment.
B. Quantitative RT-PCR analysis of CXCR4 expression in Ewing sarcoma cells grown in SFM conditions for 24 hours. Expression in each sample was normalized to the housekeeping beta 2 microglobulin (B2M) and expressed as fold-change relative to expression in standard 10% FBS conditions. Results are shown as mean ± SEM from three independent experiments.
C. Flow cytometry of CXCR4 expression in serum-starved Ewing sarcoma cells (SFM) after being returned to standard culture conditions (10%) shows reversion of expression to baseline state. Each line and pair of data points represents the data for an independent experiment.
D. TC32 cells were FACS-sorted into CXCR4 high (top 10%) and CXCR4 low (bottom 10%) populations and then both populations were maintained in standard culture conditions for 3 weeks. CXCR4 expression was monitored by flow cytometry on days 5, 12, 16 and 21 post-sorting revealing reversion over time to baseline heterogeneity. Results are shown as mean ± SEM from three independent experiments.

