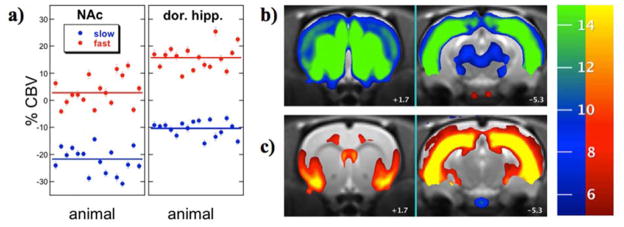
Fig. 5.

a) Individual responses (points) and average response (lines) for slow (blue) and fast (red) temporal components in nucleus accumbens (left) and dorsal hippocampus (right). b) Maps of the slow temporal response in coronal slices at the level of nucleus accumbens (left, +1.7 mm from bregma) and hippocampus (right, −5.3 mm from bregma). c) Maps of the fast temporal response in identical slices. The colorbar shows magnitude changes in CBV, with negative changes on the blue-green scale and positive changes on the red-yellow scale.
