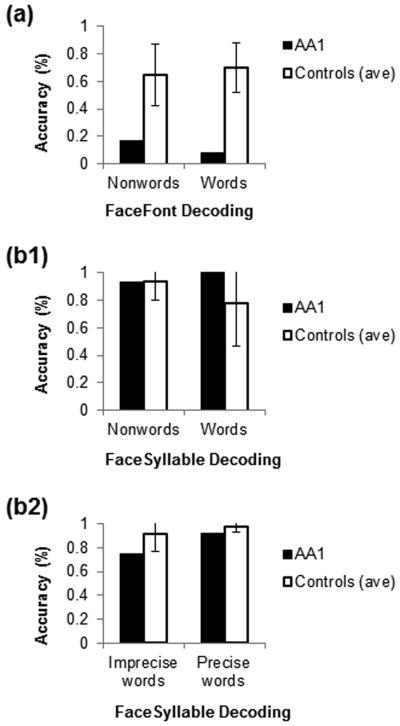
Fig. 3.
FaceFont and FaceSyllable decoding. (a) Performance on FaceFont decoding of nonwords and real words; AA1 performed 2.13 and 3.44 SDs below the control mean, respectively. (b1) AA1 had improved performance on FaceSyllable decoding; she scored identically to the control mean on FaceSyllable nonwords and 0.71 SDs above the control mean on real word items. (b2) FaceSyllable decoding in the final training stage with all 15 phonograms and only real words presented. AA1 continued to have improved performance compared to FaceFont decoding. She scored 1.15 SDs below the control mean on both imprecise and precise words. Additional scoring details are provided in Table S4.

