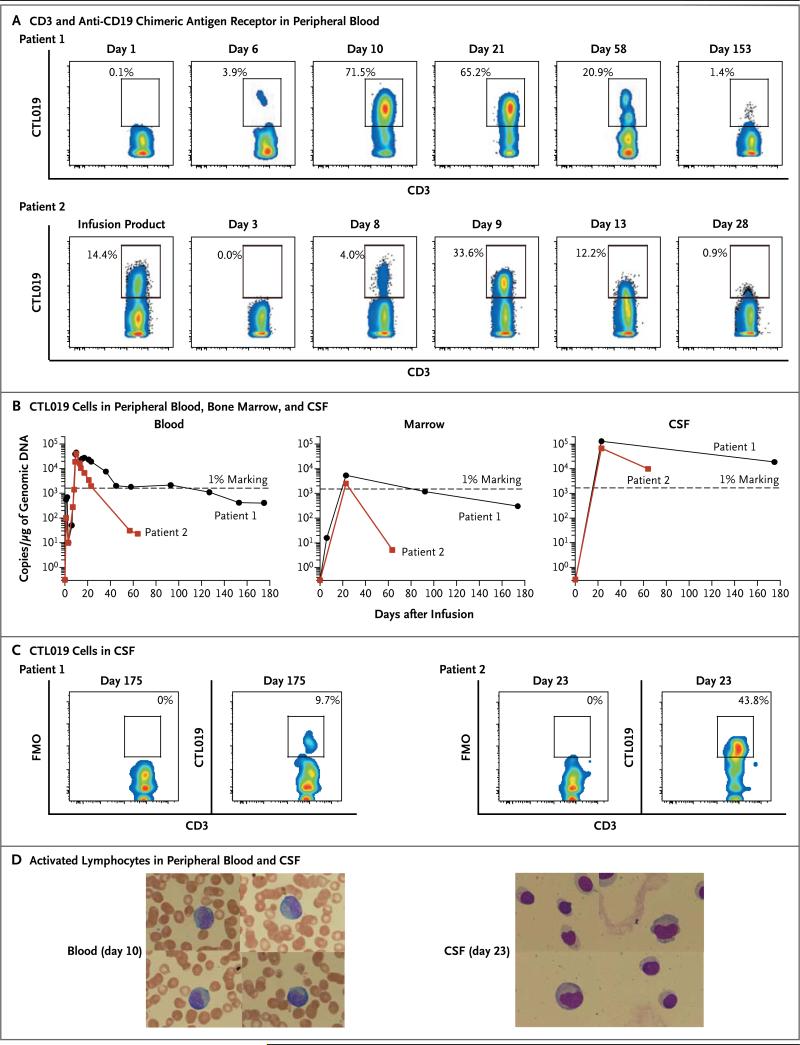
Figure 2. Expansion and Visualization of CTL019 Cells in Peripheral Blood, Bone Marrow, and Cerebrospinal Fluid (CSF).
Panel A shows the results of flow-cytometric analysis of peripheral blood stained with antibodies to detect CD3 and the anti-CD19 chimeric antigen receptor. Both the x and y axes are log10 scales. Depicted is the percentage of CD3 cells expressing the chimeric antigen receptor in Patients 1 and 2. Panel B shows the presence of CTL019 T cells in peripheral blood, bone marrow, and CSF as assessed by means of a quantitative real-time polymerase-chain-reaction (PCR) assay. Genomic DNA was isolated from samples of whole blood, bone marrow aspirate, and CSF collected at serial time points before and after CTL019 infusion. The 1% marking line represents the number of detected transgene copies that would be expected if 1% of the total cells in the sample contained a single integration of the chimeric antigen receptor transgene. Panel C shows flow-cyto-metric detection of CTL019 cells in CSF from Patients 1 and 2. FMO denotes fluorescence minus one. Both the x and y axes are log10 scales. Panel D shows activated large granular lymphocytes in Wright-stained smears of the peripheral blood and cytospin preparations of CSF from Patient 2.

