
Figure 4.
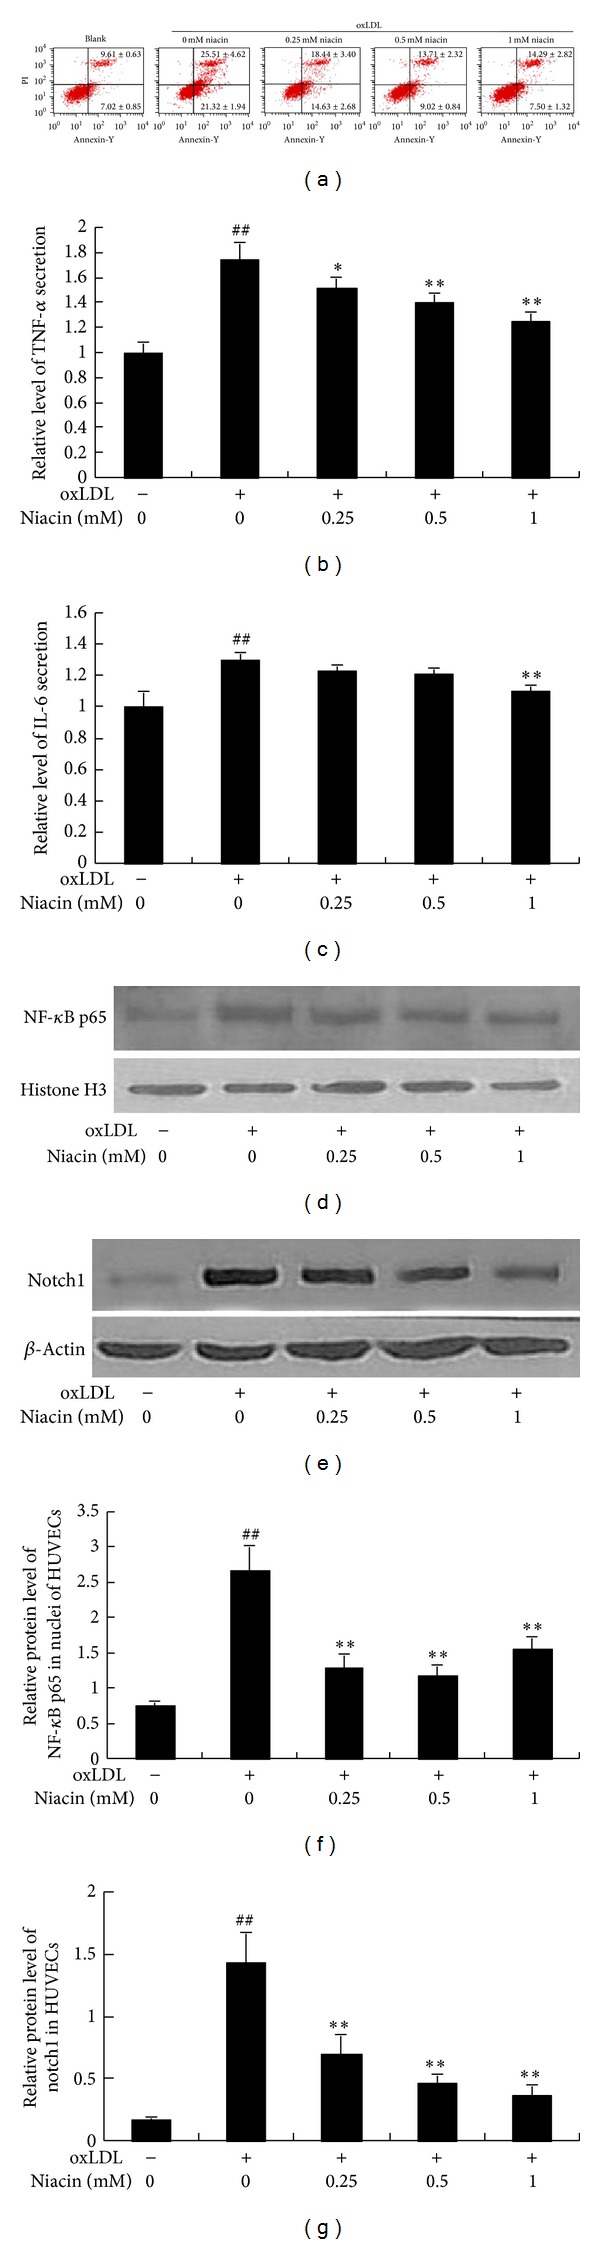
Niacin inhibited oxLDL-stimulated apoptosis and inflammation in HUVECs. (a) shows the ratio of apoptotic HUVECs stained with annexin V-FITC and PI. Representative data of flow cytometry analysis are presented. (b) and (c) show the relative levels of TNF-α and IL-6 in the medium of HUVECs. The concentrations of IL-6 and TNF-α were determined by ELISA kit. (d) and (e) show the representative images of NF-κB p65 and notch1 protein expression in HUVECs by western blot. (f) and (g) show the IOD ratios of NF-κB p65 and notch1 expression, respectively. Data are presented as mean ± SD. ## P < 0.01 versus blank group; *P < 0.05; **P < 0.01 versus oxLDL-treated group without niacin.