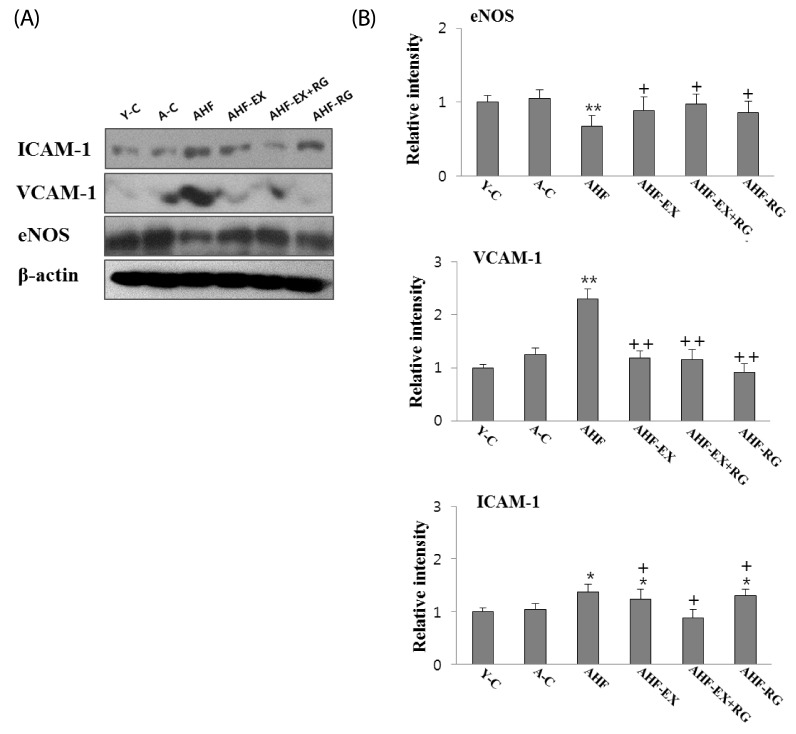
Fig. 5.
Western blotting analysis of ICAM-1, VCAM-1 and eNOS (A). The Densitometric analyses of western blotting (B) in aorta of D-gal-induced aging rats with high fat diet are shown. Y-C: Young control group, A-C: Aging control group, AHF: Aging with high fat diet group, AHF-EX: AHF with exercise training group, AHF-EX+RG: AHF-EX with Korean red ginseng, AHF-RG: AHF with Korean red ginseng. Values are means ± SEM (n = 8). *P < 0.05, **P < 0.01 vs Y-C, A-C, †P < 0.05, ††P < 0.01 vs AHF.

