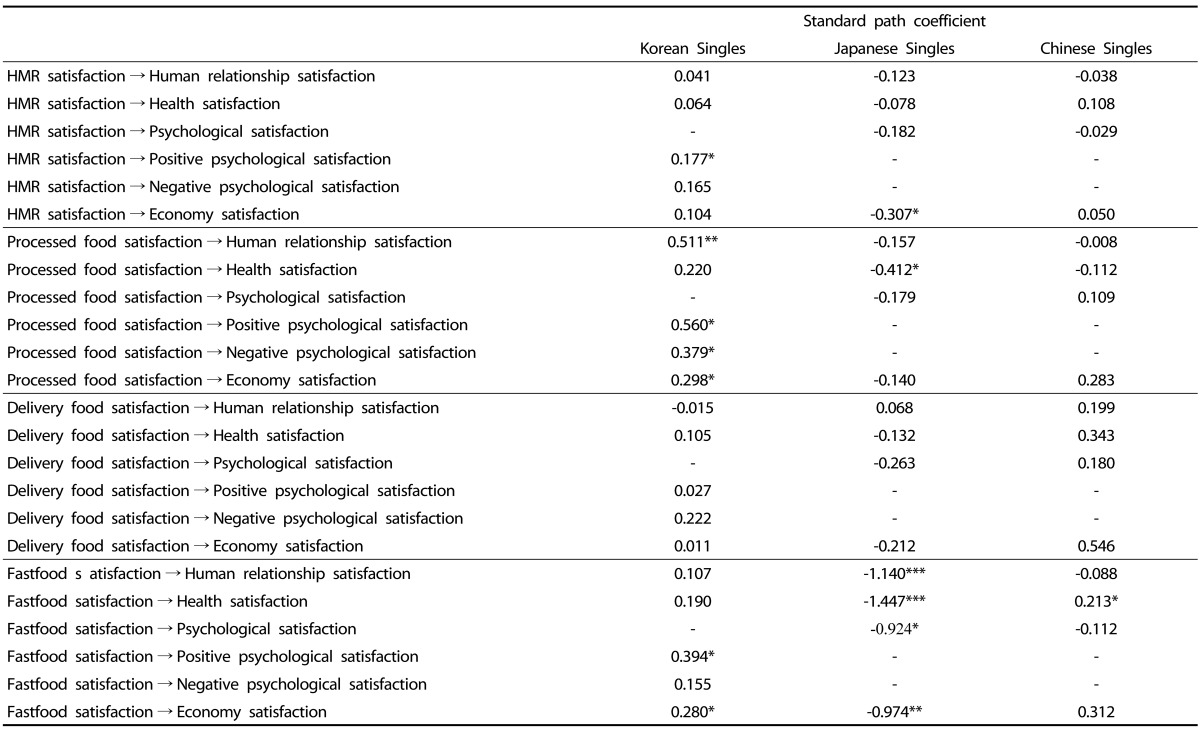
Table 2.
Path coefficient analysis of structural equation model comparison of convenience food satisfaction and quality of life

*P < 0.05. **P < 0.01, ***P < 0.001
Path coefficient analysis of structural equation model comparison of convenience food satisfaction and quality of life

*P < 0.05. **P < 0.01, ***P < 0.001