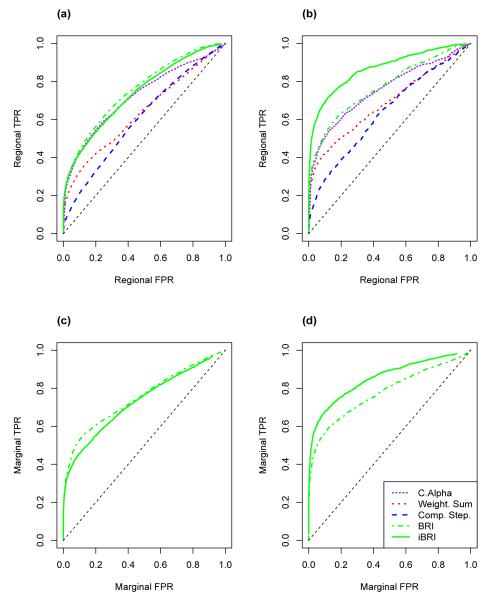
Figure 2. ROC Curves for Multiple Region Exome Study-Based Simulations.
In plots a) and b) regional false positive rates are plotted against regional true positive rates as the regional BF threshold varies for iBRI and BRI and as the regional p-value thresholds vary for the weighted sum, c-alpha, and comprehensive step-up approaches. In plots c) and d) marginal false positive rates are plotted against marginal true positive rates as the marginal BF threshold varies for iBRI and BRI. Plots a) and c) are across all non-informative simulations and plots b) and d) are across all informative simulations.

