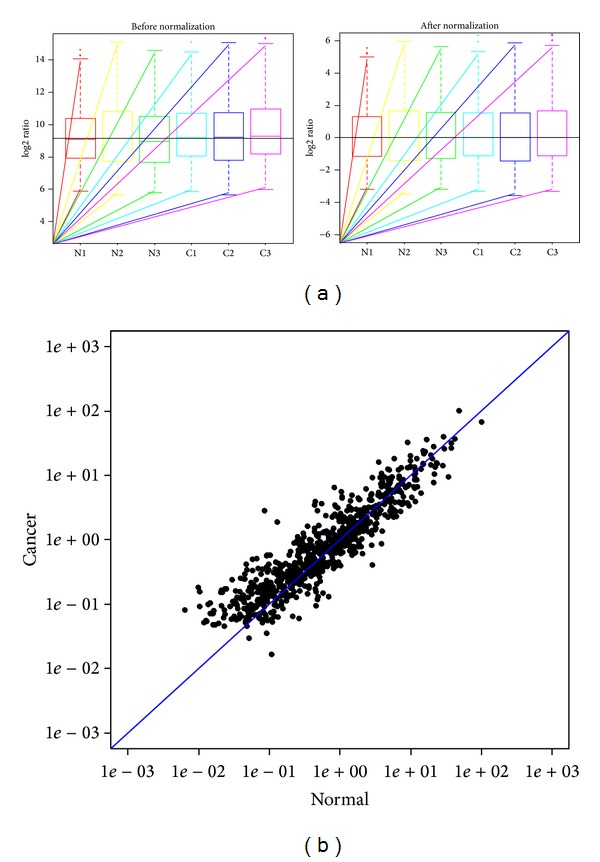
Figure 1.

(a) The box plots are used to compare distributions of samples (left: nonnormalized log2-ratio data; right: median normalized log2-ratio data). (b) The scatter-plots assess the variation of miRNAs expression between cancerous and normal tissues. The axes of the scatter-plot are the normalized signal values of the samples (ratio scale).
