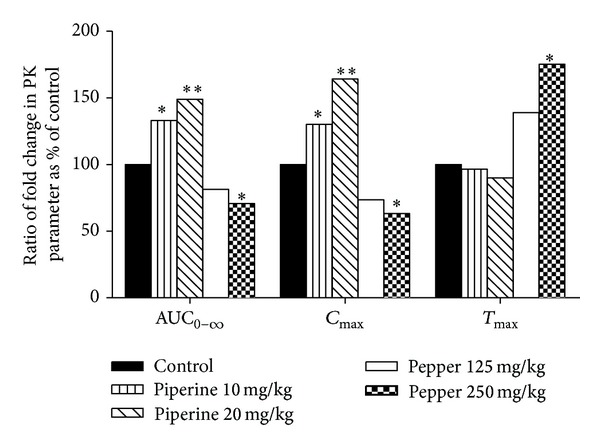
Figure 4.

Change of the AUC0–∞, C max, and T max values of puerarin as compared with control, when simultaneously administered with piperine (10 and 20 mg/kg) or pepper (125 and 250 mg/kg) and puerarin. Asterisks signs designate significant differences: *P < 0.05 versus control group given puerarin only; **P < 0.01 versus control group given puerarin only.
