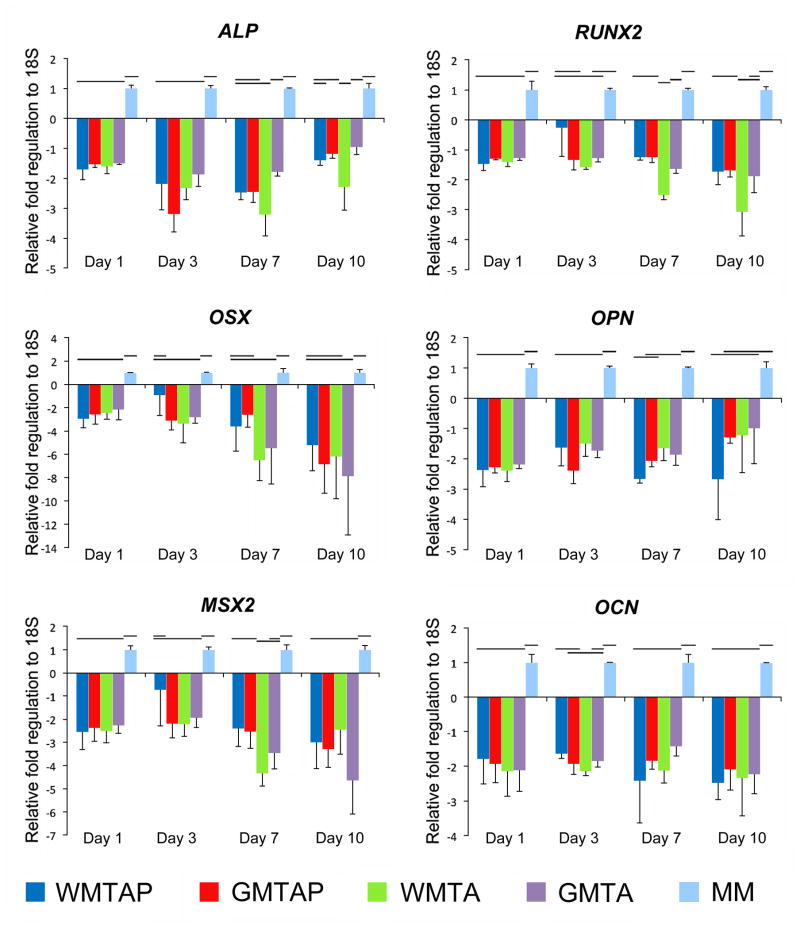
Figure 1.
Temporal profiles of mRNA expression of target osteogenic markers in hBM-MSCs after exposure to different TSCs in osteogenic differentiation medium, using qRT-PCR with 18S as the endogenous control. Groups connected with a horizontal bar are not significantly different (p>0.05). WMTAP: White MTA Plus; GMTAP: Gray MTA Plus; WMTA: White MTA; GMTA: Gray MTA; MM: untreated cells in osteogenic differentiation medium.

