
Figure 1.
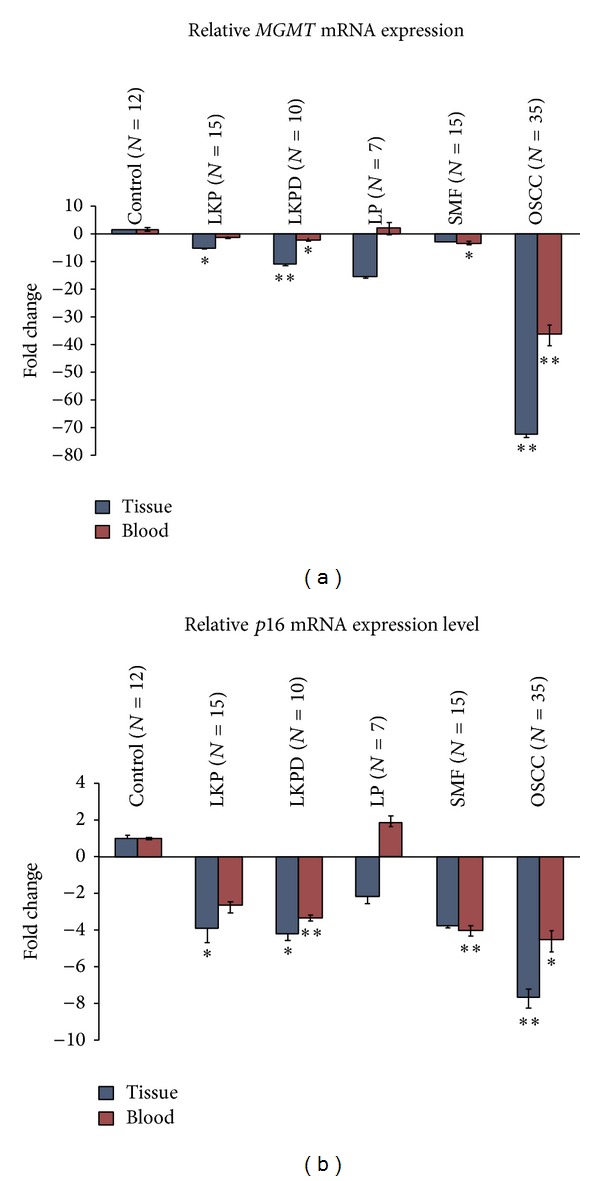
Relative mRNA expression level of MGMT and p16 genes in tissue and blood samples of different groups. Statistically significant values were represented by *P < 0.05, **P < 0.01, and ***P < 0.001.
Official websites use .gov
A
.gov website belongs to an official
government organization in the United States.
Secure .gov websites use HTTPS
A lock (
) or https:// means you've safely
connected to the .gov website. Share sensitive
information only on official, secure websites.
Relative mRNA expression level of MGMT and p16 genes in tissue and blood samples of different groups. Statistically significant values were represented by *P < 0.05, **P < 0.01, and ***P < 0.001.