
Figure 3.
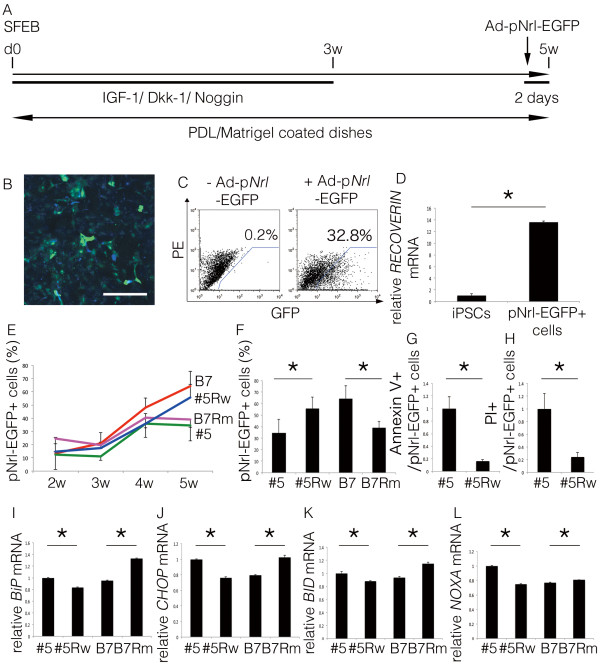
Impact of the E181K rhodopsin gene mutation on rod photoreceptor cells derived from iPSC lines. (A) Protocol of rod photoreceptor cell differentiation. (B) Expression of the rod photoreceptor cell-specific gene Nrl was visualized by infection with the Ad-pNrl-EGFP virus. (C) Flow cytometry analysis of the differentiated cells without (left) and with (right) Ad-pNrl-EGFP infection at 5 weeks. (D) The recoverin mRNA levels of the flow cytometry-purified pNrl-EGFP-positive rod photoreceptor cells derived from the #5 iPSCs compared to the undifferentiated #5 iPSCs at the same time point. (E) Quantification of the pNrl-EGFP-positive rod photoreceptor cells in each iPSC line after 2, 3, 4, and 5 weeks of differentiation. Red, B7; blue, #5Rw; pink, B7Rm; green, #5. N = 9. (F) Proportion of pNrl-EGFP-positive rod photoreceptor cells derived from iPSC lines after 5 weeks. N = 9. (G, H) The ratio of dead cells in pNrl-EGFP-positive photoreceptor cells detected by Annexin V (G) and PI (H). N = 4. (I-L) Relative mRNA levels of BiP (I), CHOP (J), BID (K), and NOXA (L) normalized to b-Actin in the pNrl-EGFP-positive cells collected after 5 weeks, as determined by a real-time PCR analysis. N = 3. Ad-pNrl-EGFP, adenovirus promoter Nrl-EGFP. *p < 0.05. Scale bar, 40 μm. Mean ± SD (with each p-values of marked by *) for iPSCs and pNrl-EGFP cells in (D) 1 ± 0.38, 13.6 ± 0.14 (p = 0.049); for #5, #5Rw, B7, B7#Rm in (F) 34.6 ± 11.7, 55.7 ± 10.0 (p = 0.035), 64.3 ± 11.3, 38.9 ± 5.8 (p = 0.013); for #5 and #5Rw in (G) 1 ± 0.18, 0.16 ± 0.02, (p = 0.019) (H) 1 ± 0.24, 0.24 ± 0.07 (p = 0.021); for #5, #5Rw, B7, B7#Rm in (I) 1 ± 0.005, 0.83 ± 0.002 (p < 0.0001), 0.95 ± 0.006, 1.33 ± 0.004 (p < 0.0001); (J) 1 ± 0.002, 0.76 ± 0.007 (p < 0.0001), 0.79 ± 0.005, 1.03 ± 0.010 (p < 0.0001); (K) 1 ± 0.016, 0.88 ± 0.006 (p = 0.003), 0.94 ± 0.008, 1.14 ± 0.013 (p < 0.0001); (L) 1. ± 0.005, 0.75 ± 0.005 (p < 0.0001), 0.77 ± 0.005, 0.80 ± 0.004 (p = 0.001). All statistical analyses in this figure were carried out by Student’s T test.