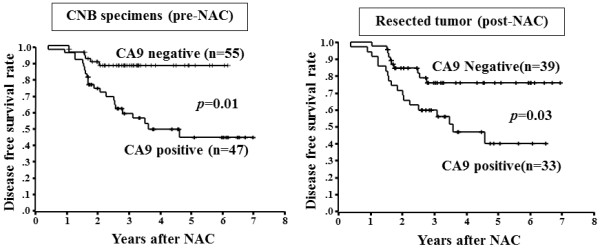
Figure 3.

Disease-free survival of patients based on CA-9 expression. The Kaplan-Meier survival curve shows the disease-free survival in relation to the CA-9 expression. A statistically significant difference in the survival was observed between the CA-9-positive and CA-9-negative groups in both CNB specimens and resected tissues (log-rank, p = 0.01 and p = 0.03, respectively).
