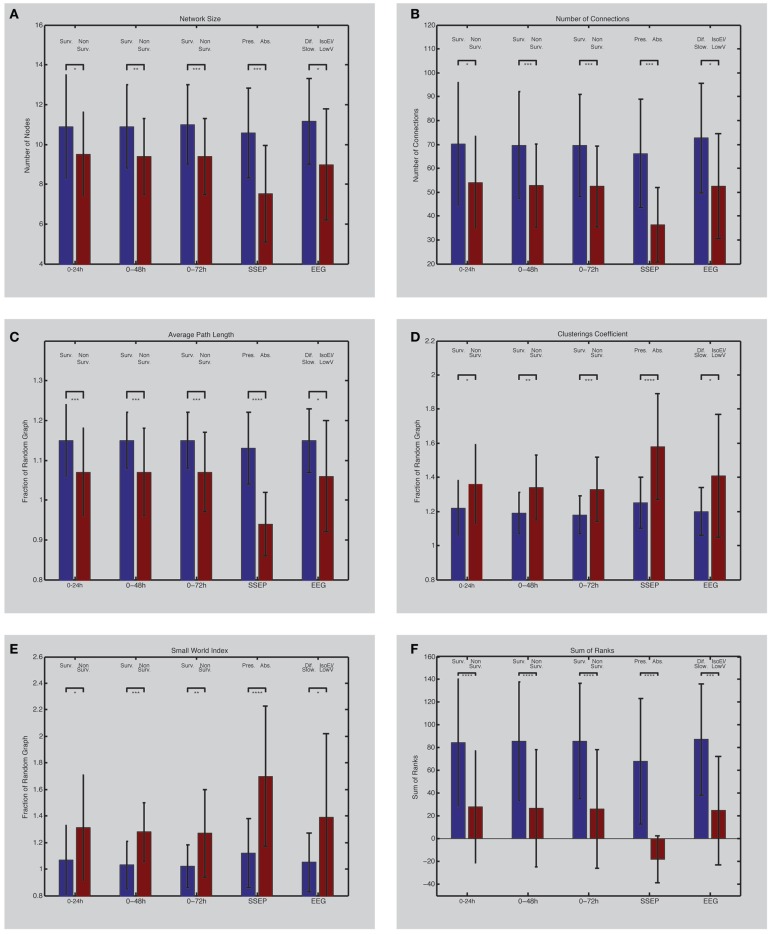
Figure 2.
(Left) EEG network characteristics of PAE survivors and non-survivors. Depicted are differences between survivors and non-survivors (first three bar couples) and their values between 0 and 24 h (1), 0 and 48 h (2), and 0 and 72 h (3) after the arrest (forth bar couple); differences between patients with bilateral absent SSEP and uni- or bilateral present SSEP (fifth bar couple); differences between patients with iso-electric or low-voltage EEG and diffuse slowing on EEG. Network size (A) is defined by the number of electrodes present in the networks. Number of connections in the network is shown in (B). Average path length (C) and clustering coefficient (D) are expressed as a fraction compared to a random network with similar size and connections. The small-world index (E) was obtained by dividing the clustering coefficient with the average path length. The sum of ranks (F) was obtained by the non-parametrical analysis of the ranked parameters (A–D). Asterisks indicate the level of significance and error bars represent standard deviations. *p < 0.05, **p < 0.01, ***p < 0.005, ****p ≤ 0.001. Surv., survivors; Non-Surv., non-survivors; Pres., uni- or bilateral present SSEP; Abs., absent SSEP; Dif. Slow., EEG with diffuse slowing; IsoEl/LowV, iso-electric of low-voltage EEG.

