
Figure 3.
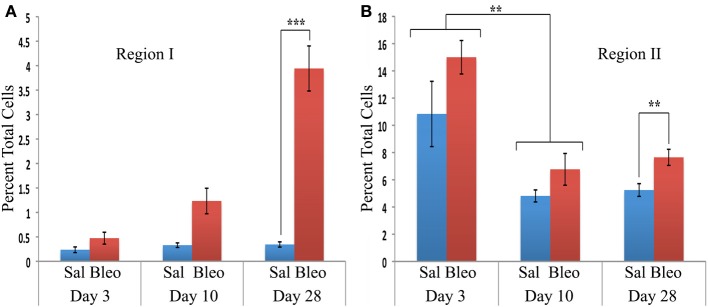
Time course of cell numbers in Regions I and II. The percent of total lung cells in Region I (A) or II (B) in saline- or bleomycin-treated mice 3, 10, or 28 days after initiation of treatment is shown. Sal, saline; Bleo, bleomycin. These data represent the average ± s.e.m. for the following number of mice in each category: 3-day saline, 3; 3-day bleomycin, 3; 10-day saline, 3; 10-day bleomycin, 3; 28-day saline, 18; 28-day bleomycin, 26. Because there was no difference between the percent of cells in Region II in saline and bleomycin lung at day 3 and at day 10, saline and bleomycin data were pooled before determining the statistical significance in the decrease in percent of cells in Region II between day 3 and 10. **p < 0.01, ***p < 0.002.