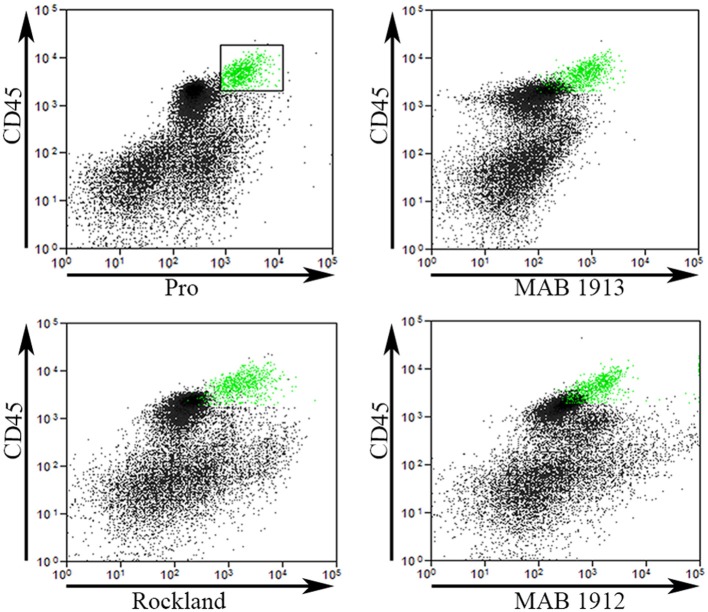
Figure 5.
Comparison of Pro to other collagen antibodies. Total lung cells from a bleomycin-treated mouse sacrificed 28 days after initiation of treatment were immunolabeled for CD45, Pro, and one of MAB1913, MAB1912, or Rockland. In the upper left panel, a scatter plot is shown with CD45 on the y-axis, Pro-on the x-axis, and a box containing Regions I and II with the cells inside the box selected and marked in green. In the other three panels, scatter plots are shown with CD45 on the y-axis and, as indicated, MAB1913, MAB1912, or Rockland on the x-axis. The same cells marked green due to their position on CD45-Pro scatter plots are green on these plots. Note that the green cells are in the same position on all panels indicating that the same cells are recognized by Pro, MAB1913, MAB1912, and Rockland. In contrast to the similarity in all four panels among CD45+ cells, note that, as described in the text, differences are seen in the position of CD45- cells. Similar results were observed in three independent experiments.

