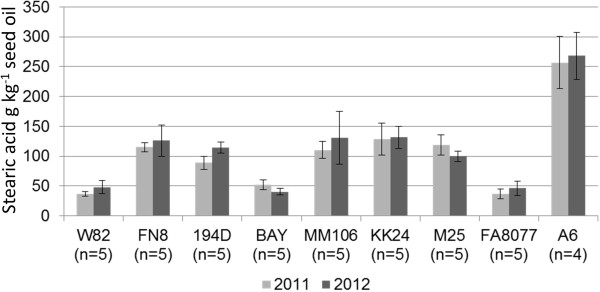
Figure 1.

Stearic acid seed phenotypes of selected radiation and EMS induced soybean mutant lines. Height of histograms indicates mean seed stearic acid content from selected radiation and EMS induced soybean mutant lines compared to their progenitors (n = 4 or 5), produced at Columbia, MO (Bradford experiment field) in Summer 2011 or Summer 2012. Bars indicated one standard deviation above/below the mean.
