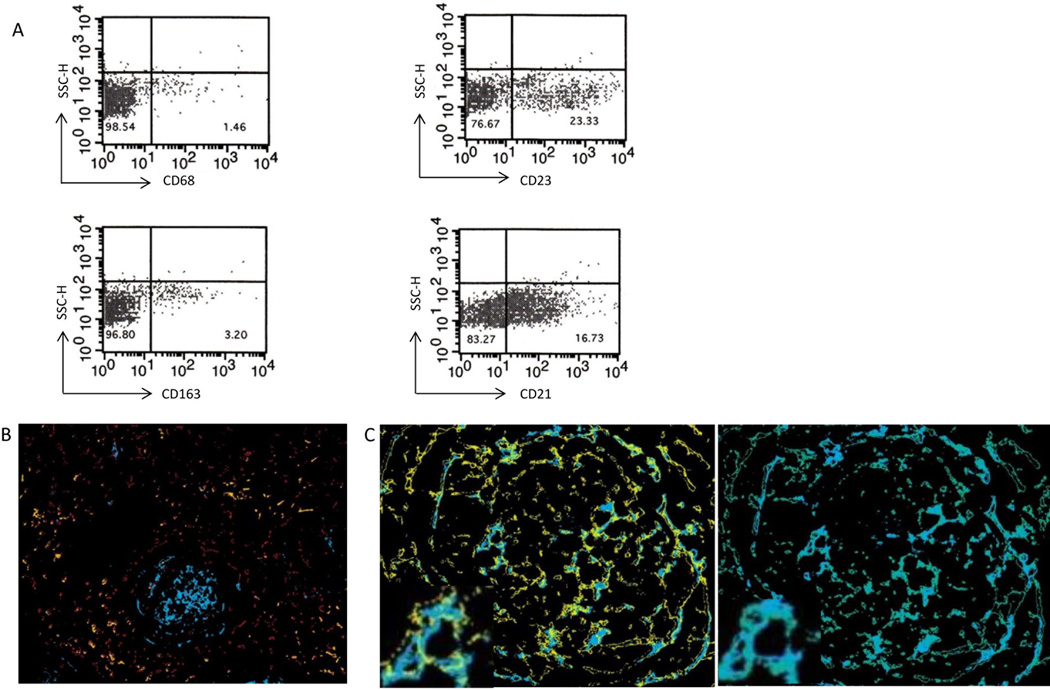
Figure 4. CD14+ cells consistent with FDC.
A) Flow cytometry demonstrates coexpression primarily on CD21 and 23 and not CD68 and 163 (n=3). B) Multicolor IHC of CD14 (blue), CD68 (red) and CD163 (orange) demonstrating no co-localization. (C) Cells staining for CD 14 (blue) co-localize to identical cells staining positive for CD21 (yellow) and CD 23 (green) exemplified on magnified inserts.

