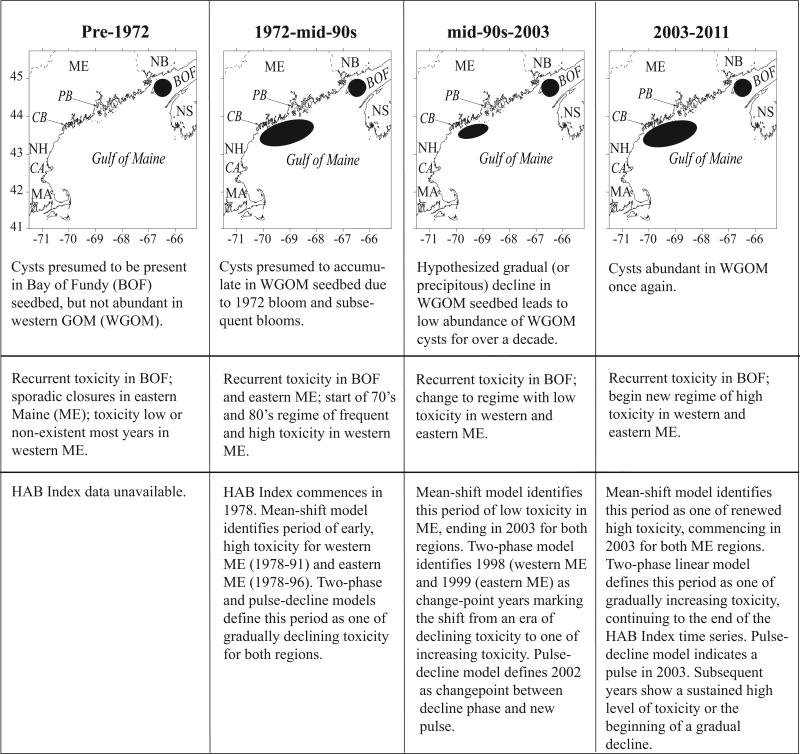
Figure 8.
Conceptual model of historical toxicity patterns and their relationship with measured and hypothesized cyst abundance and distribution in the Gulf of Maine region. The shapes used for the cyst seedbeds are not intended to be accurate but only represent general features. Note that the size of the cyst beds in the first two panels is based on inference rather than direct measurement because large-scale cyst surveys were not conducted in those years. Nevertheless, the distribution depicted is inferred from toxicity data and other observations.

