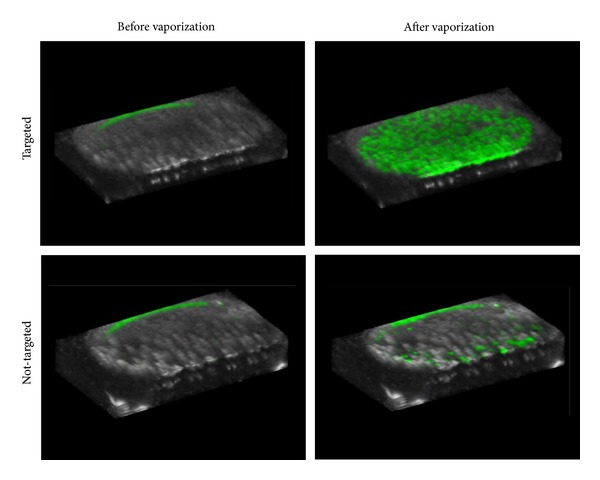
Figure 10.

Overlays of contrast-specific CPS intensity (green scale) and traditional B-mode (grey scale) ultrasound scans: 3-D rendering of the ultrasound slices across the cell sample volume reveals the contrast enhancement provided by targeted PCAs after the activation pulse. Non-targeted samples resulted in a small amount of contrast enhancement, likely as a result of non-selective binding. The small amount of contrast present at the top of each sample is an artifact of the metal holder, not a result of the presence of echogenic bubbles. Reprinted from [99], Copyright 2013, with permission from Elsevier.
