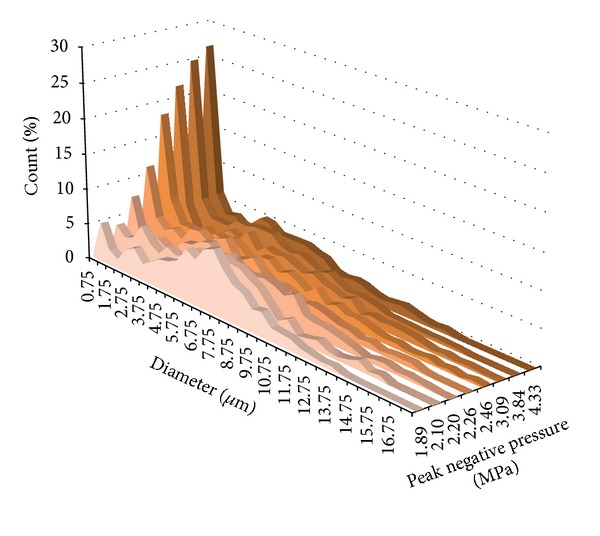
Figure 7.

Histogram of all bubble sizings taken at 5.5 MHz (N = 11,654) as a function of rarefactional pressure. As pressure increases, the number of small bubbles increases in proportion until the smallest bin size overtakes as the peak in the distribution. Continued increase in the pressures amplifies the proportion of these small bubbles relative to other bubbles present in the distribution. Reproduced from [91] with permission from the Institute of Physics in Engineering and Medicine.
