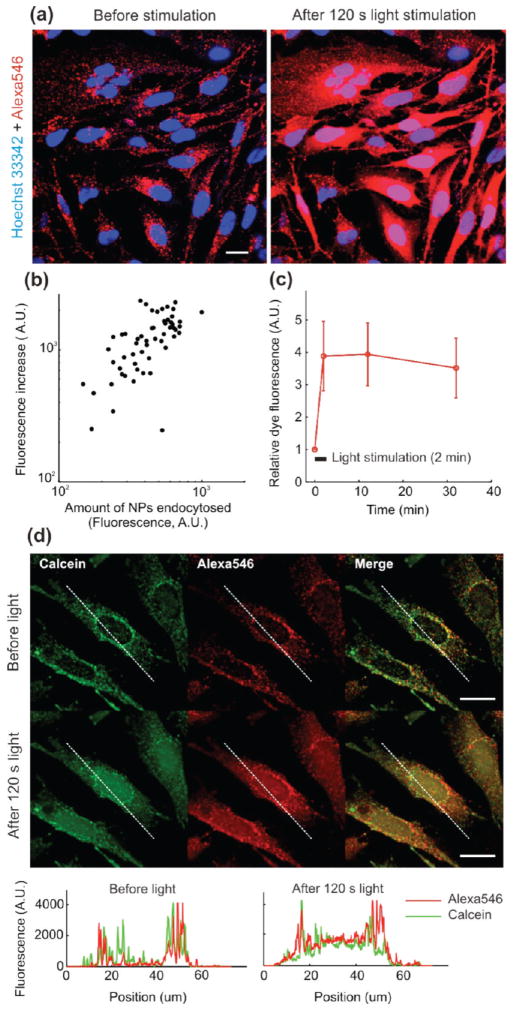
FIGURE 4.
Light-induced cytosolic release of Alexa546 loaded into mesoporous silica nanoparticles. (a) Confocal micrographs of live LN-229 cells after surface biotinylation-mediated uptake of streptavidin-functionalized particles loaded with Alexa546 (60× water-immersion objective). Images were acquired before (left panels) and immediately after (right panels) exposure to light from a TRITC-filtered mercury lamp. (b) Relationship between the amount of cytosol-released Alexa546 and the amount of endocytosed NPs. Each data point in the scatter plot represents one cell. (c) Time evolution of Alexa546 fluorescence following stimulation. Fluorescence is normalized for each cell to its initial value preceding light exposure. The bars represent SD (n = 57 cells). (d) Confocal micrographs of live LN-229 cells following overnight uptake of PEI–PEG coated NPs in the presence of calcein (0.25 mM). Images were acquired before and after 2 min light exposure as in (a). The profile plots display calcein and Alexa546 fluorescence across a representative cell before and after exposure. Scale bars are 20 μm in all images.

