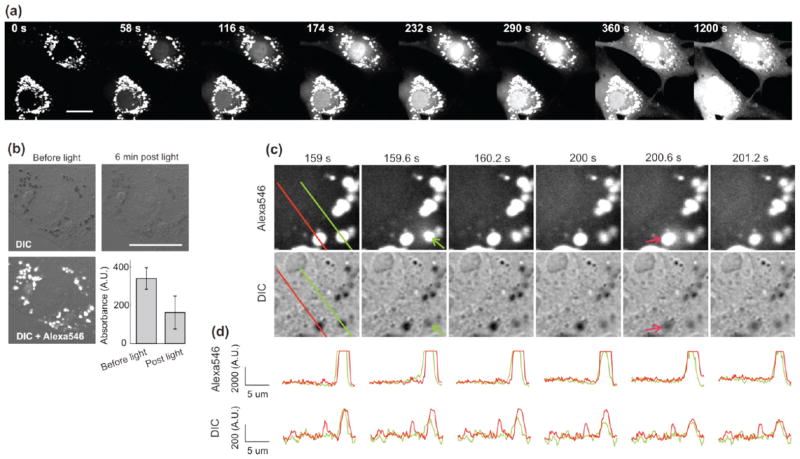
FIGURE 6.
Confocal micrographs of BAEC cells exposed to green light after overnight endocytosis of Alexa546-loaded PEI–PEG MSNs. (a) Time course of Alexa546 fluorescence at various time points following 3 s light exposure. (b) DIC images of cells before and 6 min after a 3 s light exposure showing decreased light absorption of the NP-containing lysosomes after dye release (bar diagram, mean absorbance ± SD, n = 30 vesicles). (c) Magnified view of individual vesicles at various time points following a 3 s exposure. Two individual vesicle disruptions can be seen at ~160 and 201 s following exposure. (d) Fluorescence (top row) and absorbance (from DIC transmittance, bottom) profile plots along the lines defined in (c). All scale bars are 20 μm.

