FIGURE 7.
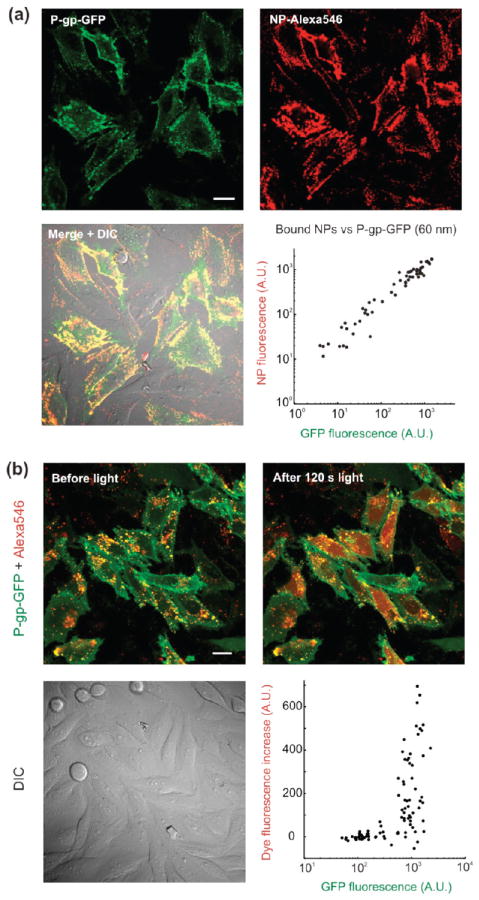
(a) Antibody-mediated targeting of mesoporous silica nanoparticles to P-gp. Confocal micrographs showing P-gp-GFP-expressing cells after incubation with streptavidin-functionalized, Alexa546 loaded NPs (60× water-immersion objective). The NPs were added following staining with a primary mouse anti-hMDR1 antibody and a biotinylated goat-antimouse secondary antibody. Plates also contained cells lacking P-gp to serve as contemporaneous controls. The bottom right graph displays the amount of NPs bound to individual cells as a function of their P-gp expression level. Each data point in the scatter plot represents one cell. The NPs used here correspond to a hydrodynamic diameter postsynthesis of ~60 nm (see Figure 1). (b) Targeted, light-activated cytosolic release of Alexa546 into cells expressing P-gp-GFP. Streptavidin-functionalized particles (75 nm diameter) were loaded with Alexa546 and targeted to cells expressing P-gp-GFP. Confocal micrographs showing cells after overnight endocytosis of targeted NPs before (left panel) and immediately after (right panel) light exposure. Cells were imaged using a 60× water-immersion objective. The scatter plot shows the variation in dye fluorescence following light exposure as a function of cell P-gp expression level. Each data point represents one cell. Scale bars are 20 μm in all images.

