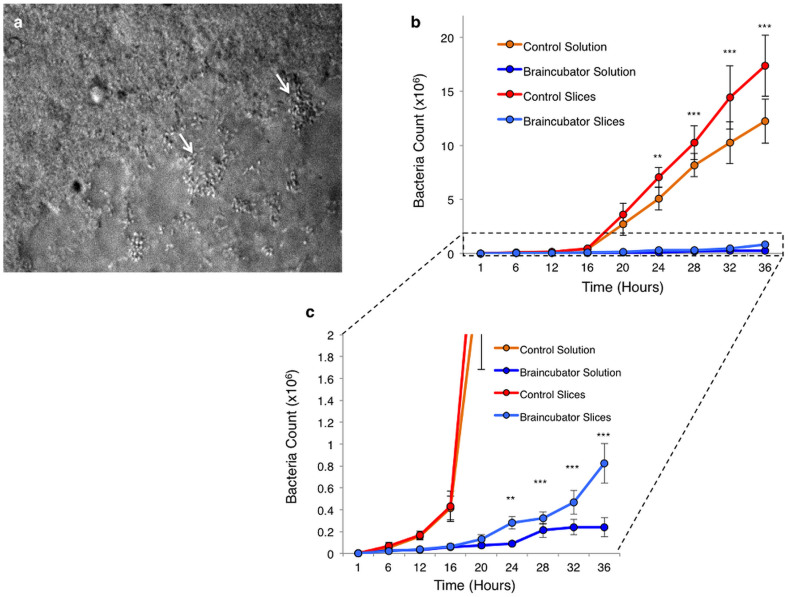
Figure 2. Bacterial growth over time.
(a) IR-DIC image of brain slice surface after 30 hours under control conditions indicating bacterial colonies (white arrows), which later lead to necrotic tissue. See also supplementary video 1. (b) Graph depicting the bacterial numbers over time following incubation with either control (n = 4) or Braincubator (n = 4) conditions. Exponential square root fit was 0.9 for both control measurements and 0.97 for Braincubator data. (c) Expansion of the area marked in B depicting the significant changes started after 12 hrs. Data displayed as Mean ± S.E.M (** P < 0.01; ***P < 0.001, mixed two-way ANOVA).

