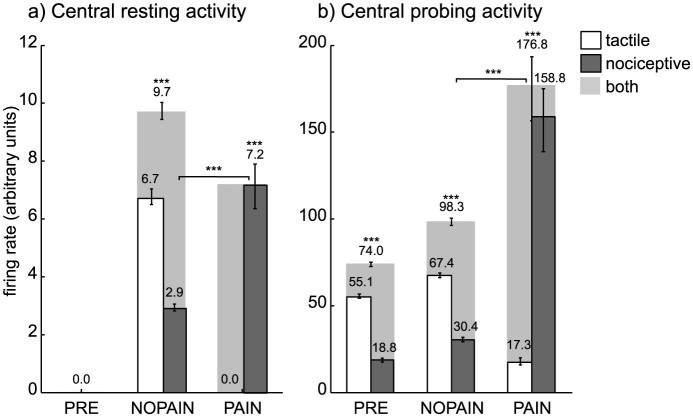
Figure 4. Central tactile (white), nociceptive (dark gray), and total (light gray) activity from sensory channels originating in the (amputated) middle finger.
(a) Central activity accumulated over the resting phase (no stimulation), and measured in terms of the normalized firing rate (arbitrary units). The values depicted are median values, so the total central activity (light gray) is the median of the sum of both tactile and nociceptive activities. The activities for the remaining fingers (not depicted) where zero on all conditions. (b) Central activity accumulated over the probing phase (during voluntary phantom movement), also measured in terms of the normalized firing rate (arbitrary units). Error bars indicate the (25,75)% quantiles, braces indicate significant differences (***: p < 0.001, Wilcoxon rank sum test, statistically corrected). The shown values result from simulations of model variation A. Model variation B is mathematically equivalent with respect to the depicted values.

