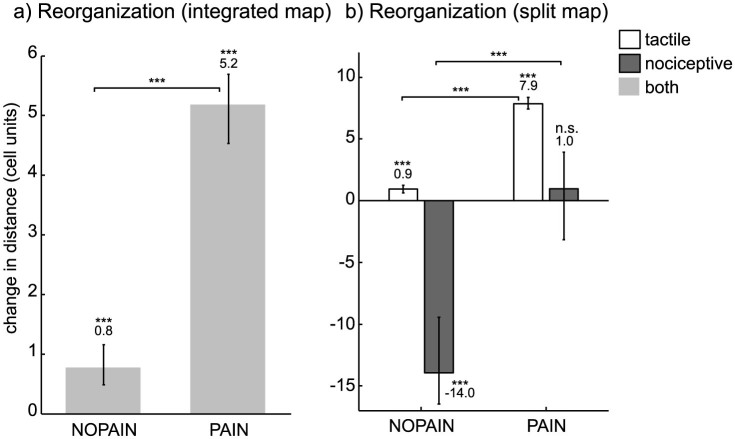
Figure 5. Cortical map reorganization after the training phase, measured by the change in distance between the centroids of the cortical representations of index finger and ring finger, measured in cell units (1 unit = distance between the centers of two neighboring cells on the cortical map), relative to the value on the PRE condition.
(a) Map reorganization for model variation A involving an integrated cortical map receiving input from both tactile and nociceptive channels. (b) Map reorganization for model variation B involving a split map receiving separate input from tactile and nociceptive channels. Positive/negative values correspond to a decrease/increase in distance between the centroids of index and ring finger. Values are expressed as medians, error bars indicate the (25,75)% quantiles, asterisks indicate significant differences to other values (above braces) and to zero (above numbers) (***: p < 0.001, n.s.: not significant, Wilcoxon rank sum test, statistically corrected).

