
Fig. 2.
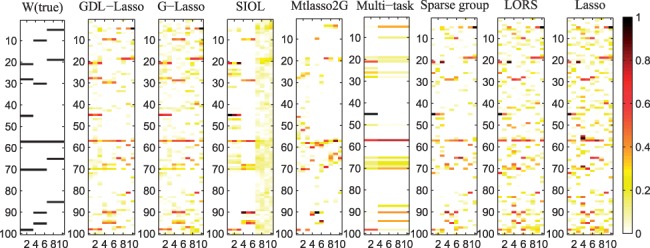
Ground truth of matrix W and that estimated by different methods. The x-axis represents traits and y-axis represents SNPs. Normalized absolute values of regression coefficients are used. Darker color implies stronger association
Official websites use .gov
A
.gov website belongs to an official
government organization in the United States.
Secure .gov websites use HTTPS
A lock (
) or https:// means you've safely
connected to the .gov website. Share sensitive
information only on official, secure websites.
Ground truth of matrix W and that estimated by different methods. The x-axis represents traits and y-axis represents SNPs. Normalized absolute values of regression coefficients are used. Darker color implies stronger association