
Fig. 5.
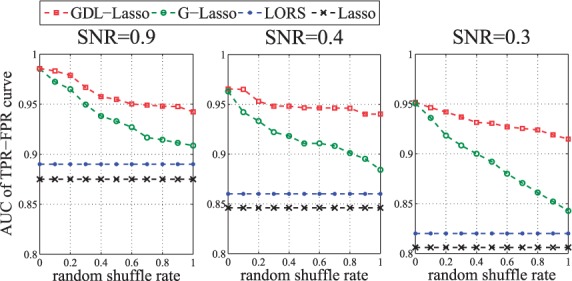
The areas under the TPR-FPR curve (AUCs) of Lasso, LORS, G-Lasso and GDL. In each panel, we vary the percentage of noises in the prior networks and
Official websites use .gov
A
.gov website belongs to an official
government organization in the United States.
Secure .gov websites use HTTPS
A lock (
) or https:// means you've safely
connected to the .gov website. Share sensitive
information only on official, secure websites.
The areas under the TPR-FPR curve (AUCs) of Lasso, LORS, G-Lasso and GDL. In each panel, we vary the percentage of noises in the prior networks and